Investment Blogs
In-depth articles on market crashes, portfolio simulations, and long-term investing strategy.
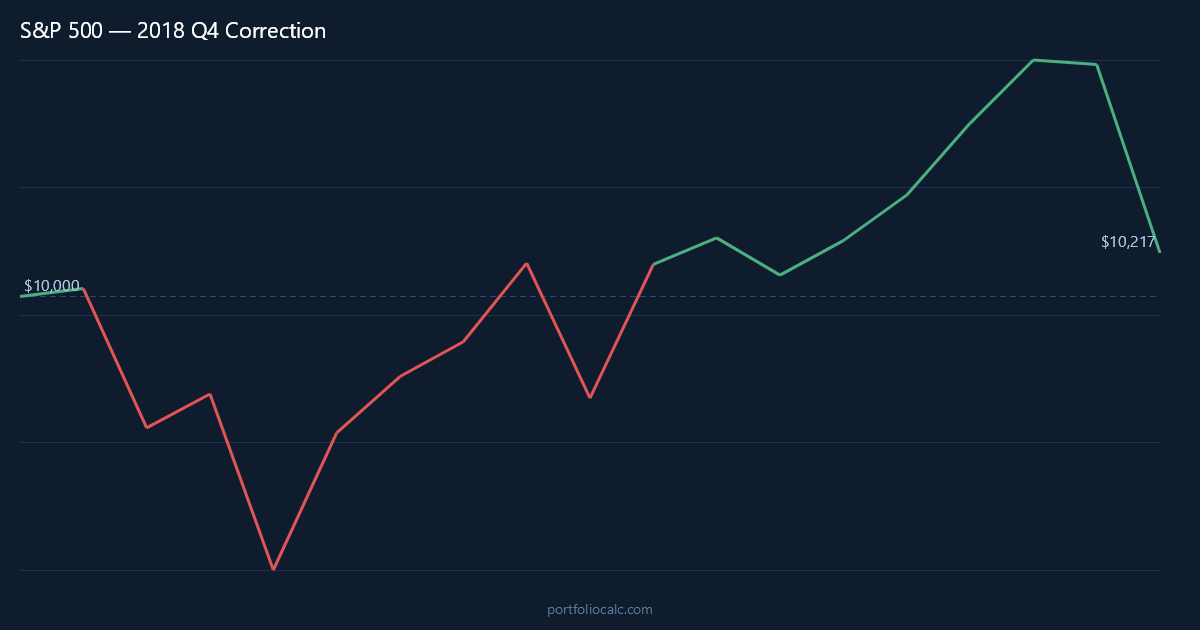
What If You Invested $10,000 in the S&P 500 Before the 2018 Q4 Correction?
The S&P 500 nearly hit bear market territory in Q4 2018, falling 19.9% in just 3 months on trade war fears and Fed rate hike concerns. How did $10,000 fare?
Read article →
What If You Invested $10,000 Before the 2015–16 China Selloff? S&P 500 vs NASDAQ vs Dow Jones vs MSCI World
Compare how the S&P 500, NASDAQ, Dow Jones, and MSCI World each handled the 2015–16 China-driven selloff. Global investors fared worst — find out why.
Read article →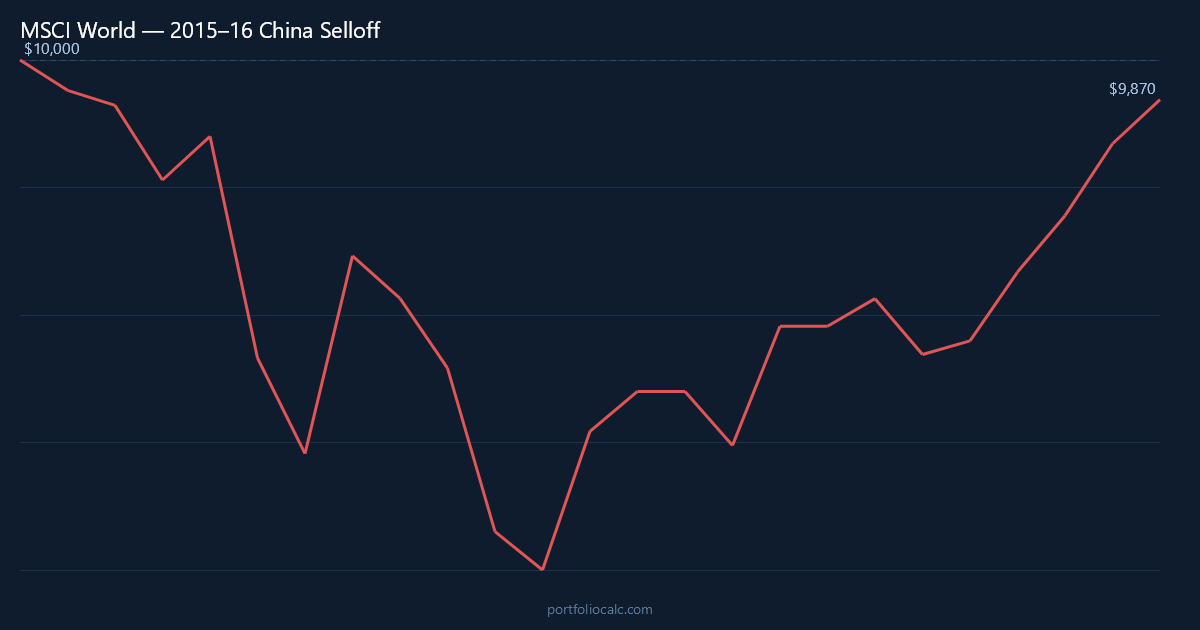
What If You Invested $10,000 in MSCI World Before the 2015–16 China Selloff?
MSCI World fell 20.2% during the 2015–16 China-driven correction — deeper than most US indices. Why did global investors fare worse, and when did $10,000 recover?
Read article →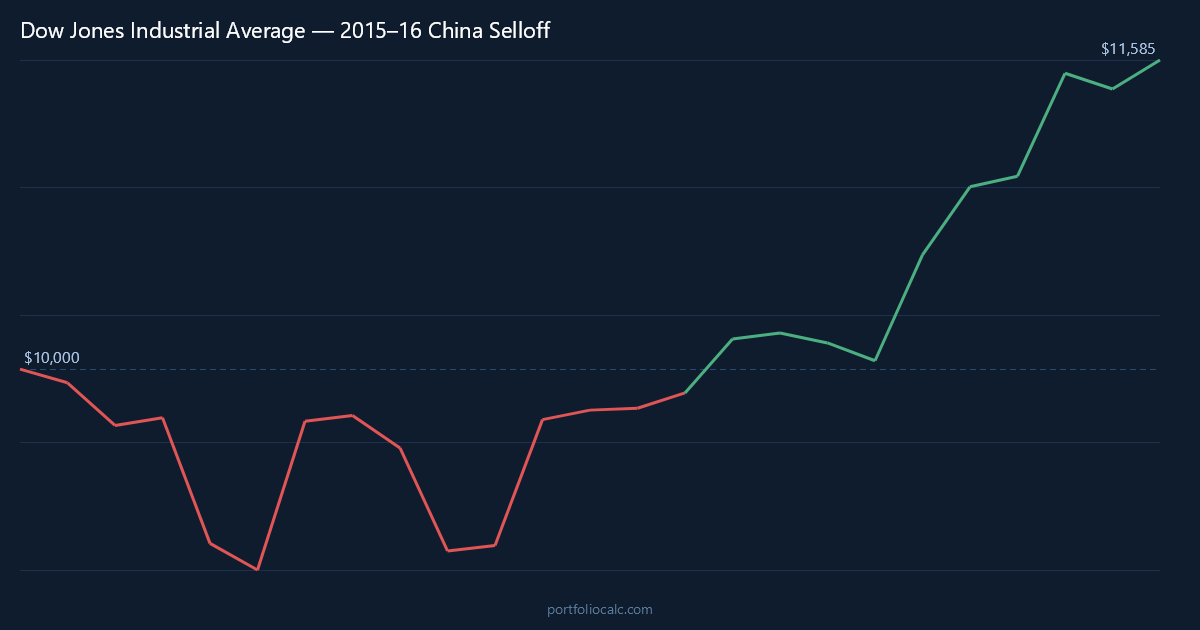
What If You Invested $10,000 in the Dow Jones Before the 2015–16 China Selloff?
The Dow Jones fell 14.7% during the 2015–16 China-driven correction. How did America's 30 industrial giants hold up, and when did $10,000 recover?
Read article →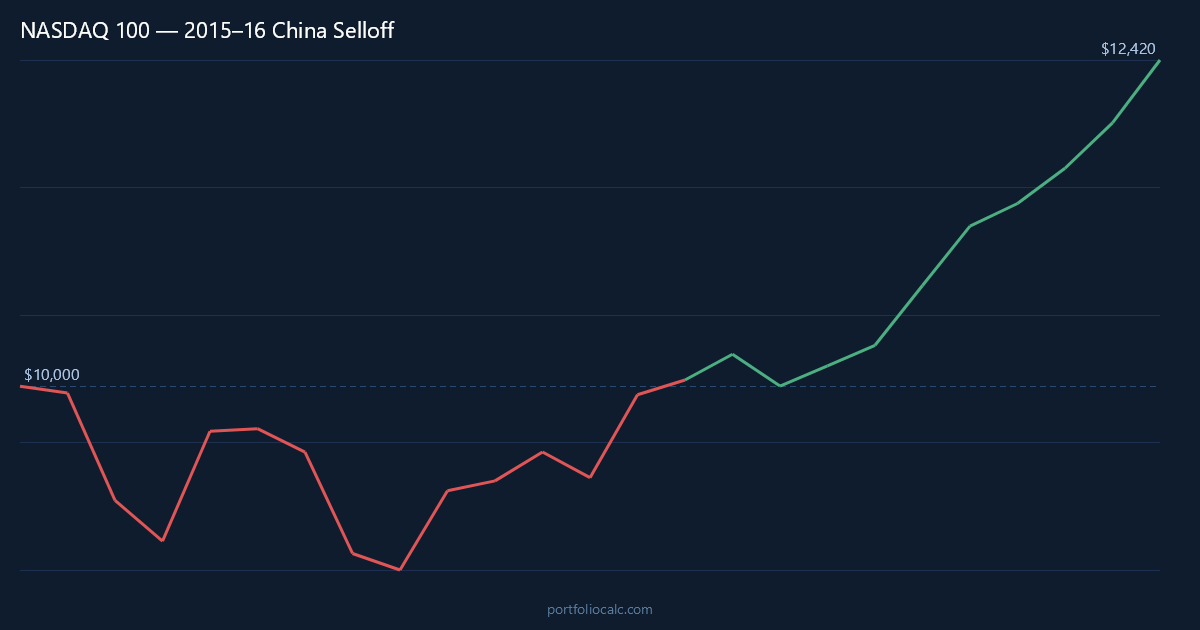
What If You Invested $10,000 in NASDAQ Before the 2015–16 China Selloff?
The NASDAQ fell 19.5% during the 2015–16 China-driven selloff. How did tech stocks compare to the broader market, and when did $10,000 recover?
Read article →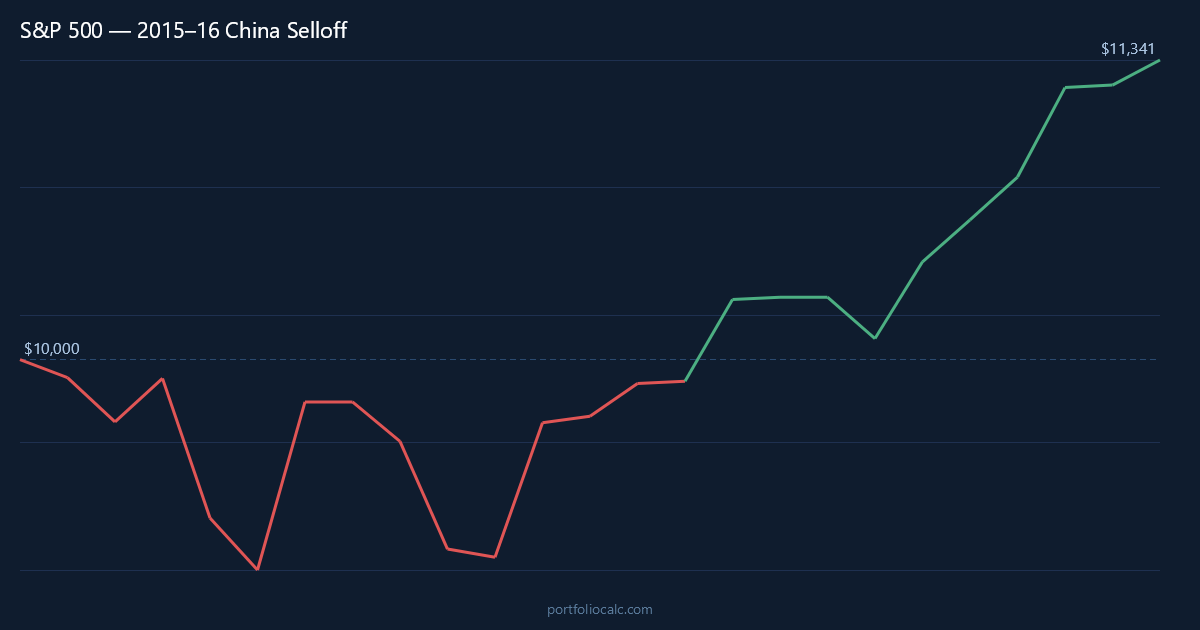
What If You Invested $10,000 in the S&P 500 Before the 2015–16 China Selloff?
China's stock market crash in 2015 triggered a global selloff. The S&P 500 fell 14.2% over 9 months. How did $10,000 fare, and how quickly did it recover?
Read article →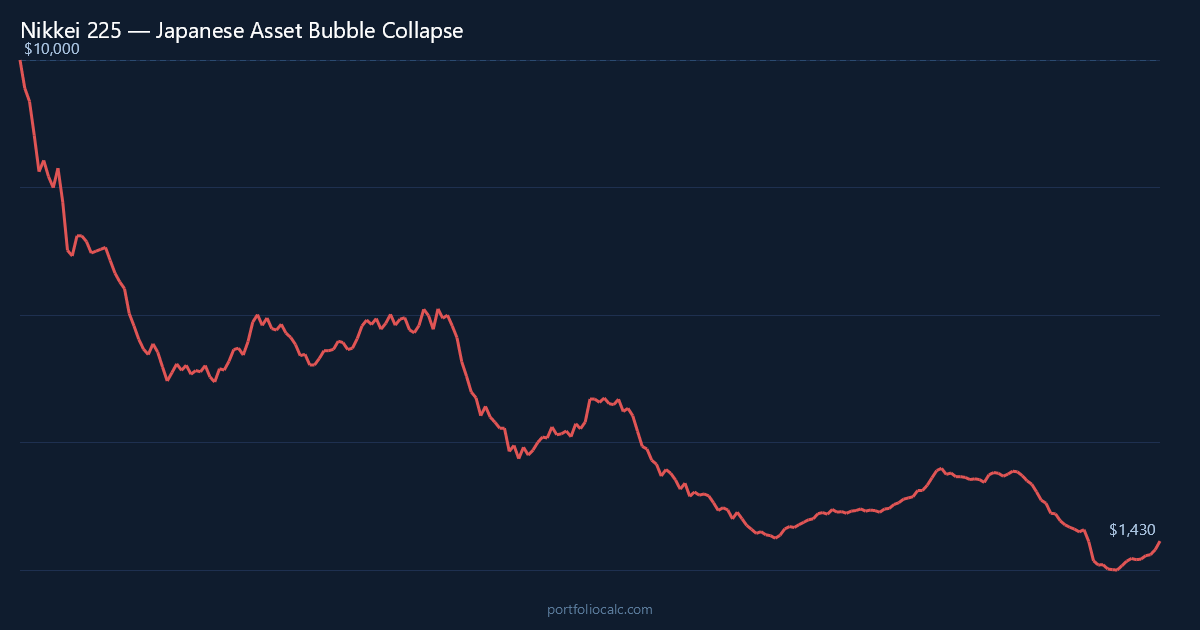
What If You Invested $10,000 in the Nikkei 225 at Japan's 1989 Market Peak?
Japan's Nikkei 225 peaked at 38,957 in December 1989 and didn't recover that level until February 2024 — 34 years later. What happened to $10,000 invested at the peak?
Read article →
What If You Invested $10,000 Before the 1973–74 Oil Crisis? S&P 500 vs Dow Jones vs MSCI World
Compare the S&P 500, Dow Jones, and MSCI World during the 1973–74 oil crisis bear market. All three fell ~45–48% as OPEC's embargo and stagflation created a global economic shock.
Read article →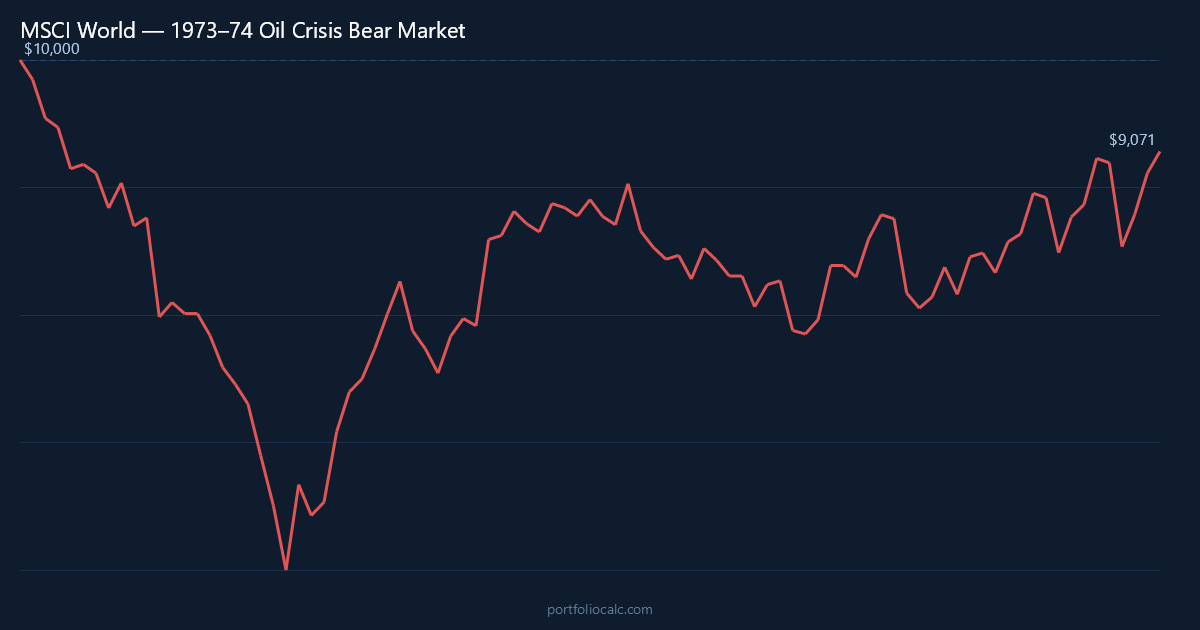
What If You Invested $10,000 in MSCI World Before the 1973–74 Oil Crisis Bear Market?
MSCI World fell 47% during the 1973–74 oil crisis. How did global diversification perform during the first major post-war oil shock, and when did $10,000 recover?
Read article →