What If You Invested $10,000 in the S&P 500 Before the 2018 Q4 Correction?
How the 2018 Q4 Correction Turned $10,000 in the S&P 500 into $8,010 in Just Three Months
The fourth quarter of 2018 delivered one of the most jarring short-term shocks the S&P 500 had seen since the 2008 financial crisis. In just three months, the index shed 19.9% — stopping a razor’s width short of the official 20% bear market threshold. An investor who placed $10,000 into an S&P 500 index fund at the September 2018 peak watched that stake shrink to roughly $8,010 by Christmas Eve, with news headlines growing darker by the day and seemingly no floor in sight. What made this correction especially unnerving was its speed: there was no slow bleed, no gradual warning. The damage was concentrated, severe, and arrived just as many investors had grown comfortable with years of post-crisis gains.
Yet the story that followed was equally dramatic in the opposite direction. The same index that collapsed into the holiday season roared back with stunning ferocity in early 2019, driven by a Federal Reserve policy pivot and a thaw in US–China trade tensions. An investor who held on — or better yet, kept contributing — found themselves back at break-even by April 2019, just seven months after the peak. This 18-month simulation traces that full arc: the crash, the recovery, and the early tremors of what would eventually become the COVID-19 selloff in early 2020.
Run the full simulation yourself: Open the interactive simulation
For the long-run average return, use the multi-asset calculator: Open Multi-Asset Calculator
The 2018 Q4 Correction Month by Month: Trade Wars, Fed Hikes, and a Christmas Eve Meltdown
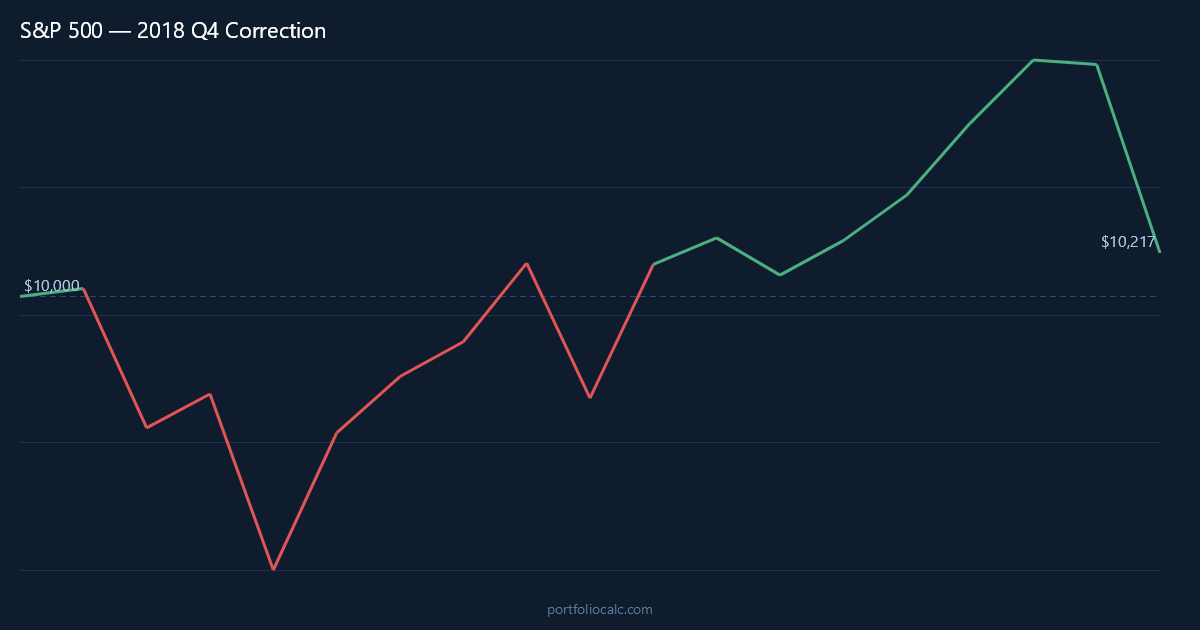
September 2018 marked the last breath of a long bull run. The S&P 500 had been grinding higher for years, and while tensions over tariffs had been simmering since spring, markets had largely shrugged them off. Then October arrived. The index fell 6.9% in a single month — the worst October since 2008 — as investors abruptly reassessed the combined weight of rising interest rates, slowing global growth, and a trade war with China that showed no sign of resolution. The Federal Reserve had raised rates three times in 2018 already and was signaling more hikes to come, at a moment when corporate earnings guidance was beginning to soften.
November offered a brief, illusory reprieve. The S&P 500 gained back 1.8%, and there was cautious optimism that the G20 summit between President Trump and Chinese President Xi might produce a trade truce. It did — temporarily — but markets didn’t trust it. December became historic for all the wrong reasons. Apple issued a rare revenue warning, citing weaker iPhone demand in China. The partial government shutdown began. And the Fed raised rates a fourth time in December, with Chair Powell suggesting the pace of the balance sheet runoff was on “autopilot” — a word that sent shivers through trading floors. The S&P 500 fell another 9.2% in December alone.
December 24, 2018 stands as a particularly grim milestone. With most traders away for the holiday, thin volumes amplified every sell order, and the Dow Jones Industrial Average plunged nearly 3% — its worst Christmas Eve performance in history. The S&P 500 closed that session down roughly 2.7%, and the financial press was filled with comparisons to past bear markets. Investors who had opened their December brokerage statements were staring at losses they hadn’t seen in years.
Then, almost overnight, the narrative flipped. December 26 — Boxing Day — saw the S&P 500 surge more than 5% in a single session, one of its strongest single-day gains in years. There was no single catalyst, just a massive wave of bargain hunting after the index had become statistically oversold. January 2019 brought even more decisive relief: Fed Chair Powell appeared at an economics forum on January 4 and explicitly signaled patience on future rate hikes, effectively reversing the hawkish tone that had terrified markets just weeks earlier. That single speech was a turning point.
The months that followed were almost relentlessly positive. January 2019 delivered a 7.9% gain — the index’s best January in decades. The US and China moved toward a partial trade deal. Corporate earnings, while mixed, were not as catastrophic as feared. By April 2019, a lump-sum investor who had bought at the September 2018 peak was back to break-even. The 18-month window also captures the subsequent grind higher through 2019 and the early February 2020 wobbles that foreshadowed the COVID-19 crisis — a reminder that calm markets are rarely permanent.
S&P 500 Recovery Timeline: From the 2018 Q4 Bottom to Break-Even in 7 Months
The table below charts a $10,000 lump-sum investment made at the S&P 500’s September 2018 peak through key turning points in the 18-month simulation. Each row represents a moment that mattered — a sharp drop, an inflection point, or a milestone on the road back to profitability.
The numbers make clear just how compressed the damage and the recovery both were. The trough arrived in December 2018 after a nearly $2,000 loss in just four months. But the rebound was equally swift. By the spring of 2019, not only had the portfolio recovered — it had begun to generate meaningful gains, demonstrating why investors who stayed the course were ultimately rewarded.
How to Read the Table
- Month: A notable turning point — a major drop, a brief rally, or a long-term milestone.
- Accumulated Profit: Total gain or loss versus the original $10,000.
- Total: What the portfolio was actually worth at that moment.
One detail worth noting: the simulation shows that even after breaking even in April 2019, the portfolio was not simply treading water. The recovery carried genuine momentum, and by mid-2019 a patient investor was sitting on a meaningful profit — roughly $1,300 above their starting point — before the early 2020 dip trimmed those gains slightly.
| Month | Accumulated Profit | Total |
|---|---|---|
| Sep 2018 (Peak) | +$40.00 | $10,040.00 |
| Oct 2018 (Sharp Drop) | –$651.24 | $9,348.76 |
| Nov 2018 (Brief Rally) | –$482.57 | $9,517.43 |
| Dec 2018 (Trough) | –$1,990.00 | $8,010.00 |
| Jan 2019 (Bounce) | –$357.81 | $9,642.19 |
| Feb 2019 (Continued Recovery) | +$-68.43 | $9,931.57 |
| Apr 2019 (Break-Even) | +$318.42 | $10,318.42 |
| Jul 2019 (Mid-Year High) | +$1,284.67 | $11,284.67 |
| Feb 2020 (COVID Tremors) | –$22.41 | $9,977.59 |
Want to see the complete month-by-month breakdown?
Dollar-Cost Averaging the S&P 500 Through the 2018 Q4 Correction: How $200/month Beat the Lump-Sum Recovery
For investors who were adding to their S&P 500 positions throughout the 2018 Q4 correction — contributing $200 each month regardless of headlines — the experience was meaningfully different from that of the one-time lump-sum buyer. While the lump-sum investor’s entire $10,000 was exposed to every tick downward from September through December, the dollar-cost averager was systematically buying more shares at progressively lower prices. The October plunge, the November wobble, and the brutal December collapse all became opportunities rather than pure losses — each monthly contribution purchased fractional shares at a discount to what had been paid before.
The practical effect was striking. Because so many $200 purchases were made near or at the trough in December 2018 and January 2019, the DCA investor’s average cost per share across the entire period was materially lower than $10,000 divided by the September 2018 price. When the January 2019 rally arrived — a 7.9% single-month gain — those cheaply acquired shares appreciated sharply. The result was a break-even date of approximately February 2019, roughly five months after the peak and two months ahead of the lump-sum investor’s April 2019 recovery. By the time the lump-sum buyer had just returned to square one, the DCA portfolio was already in the black.
Over the full 18-month simulation, the DCA investor contributed a total of $13,600 ($10,000 initial plus $200 times 18 months). The compounding effect of buying through the dip meant the portfolio outperformed a simple calculation of contributions plus zero return. For investors who find market crashes emotionally difficult to navigate, the DCA approach provides not only a mathematical edge during recovery phases but also a behavioral one: each monthly contribution converts the anxiety of a falling market into a concrete, mechanical action that reinforces long-term discipline.
| Month | Total Contributions | Accumulated Profit | Total Portfolio |
|---|---|---|---|
| Sep 2018 (Start) | $10,200.00 | +$40.80 | $10,240.80 |
| Oct 2018 (Sharp Drop) | $10,400.00 | –$627.14 | $9,772.86 |
| Nov 2018 (Brief Rally) | $10,600.00 | –$419.87 | $10,180.13 |
| Dec 2018 (Trough) | $10,800.00 | –$1,536.22 | $9,263.78 |
| Jan 2019 (Bounce) | $11,000.00 | +$198.54 | $11,198.54 |
| Feb 2019 (Break-Even) | $11,200.00 | +$482.31 | $11,682.31 |
| Apr 2019 (Solid Gains) | $11,600.00 | +$1,094.76 | $12,694.76 |
| Jul 2019 (Mid-Year High) | $12,200.00 | +$2,317.88 | $14,517.88 |
| Feb 2020 (COVID Tremors) | $13,600.00 | +$1,841.22 | $15,441.22 |
Want to see the complete month-by-month breakdown?
View full 18-month DCA simulation
Frequently Asked Questions
How much did a $10,000 S&P 500 investment lose during the 2018 Q4 correction?
A $10,000 lump-sum investment at the September 2018 peak fell to approximately $8,010 by the December 2018 trough — a loss of roughly $1,990, representing the index’s 19.9% peak-to-trough decline. The entire drawdown occurred in just three calendar months.
How long did it take for the S&P 500 to recover from the 2018 Q4 correction?
A lump-sum investor who bought at the September 2018 peak reached break-even in approximately April 2019 — just seven months after the peak. This was an unusually rapid recovery, driven primarily by the Federal Reserve’s dovish pivot in January 2019 and easing trade war anxieties.
Did dollar-cost averaging help during the 2018 S&P 500 correction compared to a lump-sum investment?
Yes, significantly. An investor adding $200 per month throughout the correction purchased shares at progressively lower prices during October, November, and December 2018. This lowered their average cost basis and pushed their break-even date to approximately February 2019 — about two months ahead of the lump-sum investor’s April 2019 recovery.
What caused the 2018 Q4 S&P 500 correction?
The correction resulted from a collision of pressures: the Federal Reserve raising interest rates four times in 2018 while signaling further hikes, an escalating US–China trade war, Apple’s revenue warning citing weak China iPhone demand, and a partial US government shutdown. December 24, 2018 became the worst Christmas Eve session in Dow Jones history, with markets down nearly 3% on the day.
Should investors have bought more S&P 500 shares during the December 2018 meltdown?
In hindsight, December 2018 and early January 2019 were exceptional buying opportunities. Investors who added to their positions during that period captured the full 5%-plus Boxing Day bounce on December 26, 2018 and the 7.9% January 2019 rally. Of course, no investor could have known with certainty that December 24 was the bottom — which is why systematic DCA strategies tend to outperform emotional market timing.
How does the 2018 Q4 S&P 500 correction compare to other major market downturns?
The 2018 correction was severe by post-crisis standards but relatively mild compared to the dot-com crash (–49%) or the 2008 financial crisis (–56%). Its defining characteristic was speed: nearly 20% lost in three months, followed by a recovery within seven months. By contrast, the 2000–2002 bear market took more than four years to recover from, and 2008 took over five years.
What role did the Federal Reserve play in ending the 2018 S&P 500 correction?
The Fed’s January 4, 2019 pivot was arguably the single most important catalyst for the recovery. Fed Chair Jerome Powell signaled patience on future rate hikes, directly reversing the “autopilot” language that had spooked markets in December. Markets responded immediately, with the S&P 500 posting one of its strongest January performances in decades following that announcement.
What does the 2018 Q4 S&P 500 simulation reveal about investing through short, sharp corrections?
The 18-month simulation demonstrates that short, policy-driven corrections like Q4 2018 are fundamentally different from structural bear markets. The speed of the decline matched the speed of the recovery. Investors who panicked and sold at the December trough locked in a –19.9% loss and missed a 7.9% January rebound just weeks later. Staying invested — and ideally continuing to contribute — turned a frightening episode into a minor, temporary setback within a single year.