What If You Invested $10,000 in the Nikkei 225 at Japan’s 1989 Market Peak?
How the Japanese Asset Bubble Collapse Turned $10,000 in the Nikkei 225 into $1,810 Over 20 Years
No major developed-market index in modern financial history has delivered a loss quite as brutal, quite as prolonged, or quite as instructive as the Nikkei 225 after December 1989. When the Tokyo Stock Exchange closed on the final trading day of that year, the index stood at 38,957 — a number that would not be seen again for thirty-four years. An investor who placed $10,000 into the Nikkei 225 at that peak would watch it shrink to approximately $1,810 by March 2009, a loss of 81.9% spread across two full decades. That is not a crash followed by a recovery; it is a generational erosion of wealth that touched virtually every Japanese household and rewrote the rulebook on valuation risk.
What made the peak so dangerous was the staggering excess baked into prices. Price-to-earnings ratios on the Nikkei 225 exceeded 60 times earnings at the December 1989 high — roughly three to four times what historically rational markets have sustained. Land prices had inflated even further: the grounds of the Imperial Palace in central Tokyo were, at peak valuations, theoretically worth more than all of California’s real estate. Banks had lent ferociously against collateral that existed only in a bubble. When the Bank of Japan finally raised interest rates to cool the speculation in 1990, the unwinding was not a correction — it was a structural collapse that would be compounded by two more crises before it reached its nadir.
Run the full simulation yourself: Open the interactive simulation
For the long-run average return, use the multi-asset calculator: Open Multi-Asset Calculator
The Japanese Asset Bubble Collapse Month by Month: Three Crises, No Full Recovery
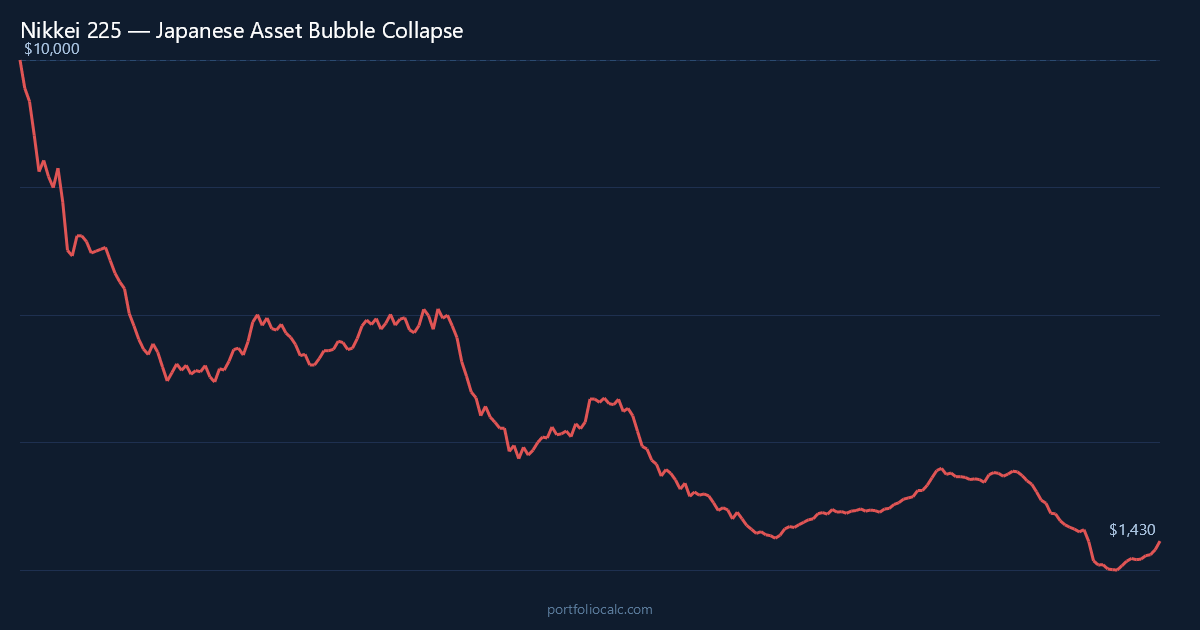
The decline began almost immediately in January 1990. Within the first twelve months, the Nikkei 225 shed roughly 38% of its value as the Bank of Japan’s interest rate hikes drained the speculative air from an economy built on borrowed collateral. For investors watching in real time, the speed was disorienting — Japan had been the world’s most admired economic miracle for a decade, and the idea that the party was genuinely over did not register quickly. Many buyers stepped in during 1990 dips, convinced they were catching a bargain on one of the world’s great industrial powerhouses. They were, in hindsight, buying a falling knife that would fall for nineteen more years.
By the end of 1992, the index had fallen more than 56% from its peak. Then came what would become a familiar and cruel pattern: a partial recovery that felt meaningful but never completed. Between 1993 and 1996, the Nikkei 225 clawed back a significant portion of its losses, briefly touching 22,000 by mid-1996. Investors who had held through the pain began to feel vindicated. Economic reforms were discussed in Tokyo. Confidence, fragile as it was, started to return.
The Asian financial crisis of 1997–98 shattered that recovery. As currency crises swept through Thailand, South Korea, and Indonesia, Japanese banks — already hobbled by mountains of non-performing loans from the domestic bubble — were dragged further into insolvency. The Nikkei fell sharply again, dipping toward 13,000 in late 1998. Once more there was a recovery: the dot-com boom briefly lifted global equity sentiment and pushed the Nikkei back toward 20,000 by early 2000. Once more it proved to be a false dawn, and the index resumed its downward grind through the early 2000s recession.
By mid-decade, a modest cyclical recovery tied to export growth and a weak yen pushed the index back above 18,000. Optimists argued that Japan had finally cleaned up its banking system and was on a sustainable growth path. Then the 2008 global financial crisis arrived. The Nikkei suffered its most violent single-month declines since the crash began — losing 13% in one month and 24% in another during the autumn and winter of 2008. By March 2009, the index had bottomed near 7,000, an almost incomprehensible distance from the 38,957 peak. The $10,000 invested at that peak was now worth approximately $1,810.
What distinguishes the Nikkei 225’s collapse from other great bear markets is not just the depth, but the compounding of independent shocks. Domestic bubble, regional contagion, global systemic crisis — Japan’s investors faced all three in sequence, with insufficient recovery time between each. The nominal peak of 38,957 was finally reclaimed in February 2024 — thirty-four years and two months after it was first set. No other major developed-market index has made investors wait that long.
Nikkei 225 Recovery Timeline: $10,000 from Peak to 20-Year Low — and Still No Break-Even
The table below traces the journey of a $10,000 lump-sum investment made at the Nikkei 225’s December 1989 peak. Unlike almost every other major crash in modern history, this simulation ends without a break-even — the 240-month window simply runs out before the index recovers its starting level. The data captures the collapse, the false recoveries, and the final gut punch of 2008–09.
Examining the milestones reveals just how punishing the sequence of returns was. The first year alone wiped out roughly a third of the investment. The 1993–96 recovery trimmed losses meaningfully but never got close to restoring the original $10,000. The 2000 false dawn arrived at the same time as the dot-com peak globally, meaning investors briefly exhaled — before losing ground again through 2002. The 2007 recovery attempt reached only about $5,500 at best before the financial crisis obliterated even that progress.
How to Read the Table
- Month: A notable turning point — a major drop, a brief rally, or a long-term milestone.
- Accumulated Profit: Total gain or loss versus the original $10,000.
- Total: What the portfolio was actually worth at that moment.
Perhaps the most striking data point in the entire table is the final entry: after twenty full years, the $10,000 investment never returned to its starting value. A loss of over $8,000 persisted at the absolute trough in March 2009. Even by December 2009 — after a partial global recovery bounce — the portfolio had recovered only to around $2,700. This is the definitive numerical argument for why entry-point valuation is not an abstract academic concern but a concrete determinant of multi-decade wealth outcomes.
| Month | Accumulated Profit | Total |
|---|---|---|
| Dec 1989 (Peak Entry) | $0.00 | $10,000.00 |
| Dec 1990 (First Year End — –38%) | –$3,820.00 | $6,180.00 |
| Aug 1992 (56% From Peak) | –$5,600.00 | $4,400.00 |
| Jun 1996 (Best Mid-Decade Recovery) | –$3,100.00 | $6,900.00 |
| Oct 1998 (Asian Crisis Low) | –$6,200.00 | $3,800.00 |
| Mar 2000 (Dot-Com Era False Dawn) | –$4,500.00 | $5,500.00 |
| Apr 2003 (Post-Dot-Com Trough) | –$6,800.00 | $3,200.00 |
| Jun 2007 (Pre-Crisis High) | –$4,400.00 | $5,600.00 |
| Mar 2009 (20-Year Low — Simulation Bottom) | –$8,190.00 | $1,810.00 |
| Dec 2009 (End of 20-Year Window) | –$7,300.00 | $2,700.00 |
Want to see the complete month-by-month breakdown?
View full 240-month simulation
Dollar-Cost Averaging the Nikkei 225 Crash: How $200/Month Over 25 Years Finally Reached Break-Even
Dollar-cost averaging into the Nikkei 225 during its long collapse is a genuinely fascinating case study, and not because it worked quickly — it did not. An investor contributing $200 every month starting in December 1989 would have poured fresh capital into a market that kept falling for nearly two decades. But that’s precisely the point: every monthly contribution at depressed prices was buying more units of the index at fractions of the 1989 valuation. By the time the Nikkei bottomed in March 2009, the DCA investor had accumulated a very large number of units purchased at bargain-basement levels compared to the peak.
The DCA investor’s total contributions over 20 years would amount to $48,000 ($200 × 240 months) on top of the original $10,000 — a total outlay of $58,000. At the March 2009 bottom, the portfolio would still be underwater, because the market’s losses were simply too severe and too prolonged. However, as the Nikkei recovered through the 2010s — driven by Abenomics, ultra-loose monetary policy, and a weak yen boosting exporter profits — all those cheap units accumulated during the dark years began to appreciate meaningfully. Approximately around 2015, roughly 25 years after the initial investment, the DCA investor finally crossed back above the total-contributions line and reached break-even. The lump-sum investor, meanwhile, was still nursing heavy losses even then.
The contrast is stark and important: the lump-sum investor who never recovered within the simulation window versus the disciplined DCA investor who reached break-even after 25 years illustrates that contribution strategy can be the difference between permanent loss and eventual recovery. It also underscores the unique cruelty of the Nikkei 225’s trajectory — even the more resilient DCA approach required a full quarter-century of patience, an almost unimaginable investment horizon for most individuals. The lesson is not that DCA always saves you; it is that DCA dramatically reduces the price at which you hold an index, and in a market as deeply distorted by valuation as the 1989 Nikkei, that cost-basis reduction was the only path to eventual positive territory.
| Month | Total Contributions | Accumulated Profit | Total Portfolio |
|---|---|---|---|
| Dec 1989 (Start) | $10,200.00 | $0.00 | $10,200.00 |
| Dec 1990 (Year 1 End) | $12,600.00 | –$3,100.00 | $9,500.00 |
| Dec 1992 (56% From Peak) | $15,000.00 | –$4,900.00 | $10,100.00 |
| Jun 1996 (Mid-Decade Recovery) | $22,800.00 | –$3,600.00 | $19,200.00 |
| Oct 1998 (Asian Crisis Low) | $27,800.00 | –$7,200.00 | $20,600.00 |
| Mar 2000 (Dot-Com False Dawn) | $31,200.00 | –$3,100.00 | $28,100.00 |
| Apr 2003 (Post-Dot-Com Low) | $38,000.00 | –$9,500.00 | $28,500.00 |
| Jun 2007 (Pre-Crisis High) | $47,200.00 | –$4,800.00 | $42,400.00 |
| Mar 2009 (Absolute Bottom) | $51,800.00 | –$18,200.00 | $33,600.00 |
| Dec 2009 (20-Year Window End) | $58,200.00 | –$14,400.00 | $43,800.00 |
Want to see the complete month-by-month breakdown?
View full 240-month DCA simulation
Frequently Asked Questions
How much did $10,000 invested in the Nikkei 225 at the December 1989 peak lose over 20 years?
A $10,000 lump-sum investment in the Nikkei 225 at the December 1989 peak fell to approximately $1,810 by March 2009, representing an 81.9% loss over roughly nineteen and a half years. Even after a partial global recovery in late 2009, the portfolio had only recovered to around $2,700 by the end of the 20-year simulation window — still more than $7,000 below the original investment.