What If You Invested $10,000 in MSCI World Before the 1973–74 Oil Crisis Bear Market?
How the 1973–74 Oil Crisis Turned $10,000 in MSCI World Into $5,300 — A 47% Collapse Across Every Developed Market
Few events in financial history exposed the limits of diversification as brutally as the 1973–74 oil crisis. When OPEC announced its embargo in October 1973, the ripple effects were not confined to one country or one sector — they struck every oil-dependent economy on the planet simultaneously. For an investor who placed $10,000 into a globally diversified MSCI World portfolio at the January 1973 peak, the next two years delivered a 47% loss, reducing that stake to roughly $5,300 by December 1974. What made this crash uniquely painful was that there was nowhere to hide: geographic diversification, the core promise of a world index, provided almost no shelter at all.
The MSCI World index — which tracks large and mid-cap equities across developed markets including the United States, Europe, Japan, Australia, and Canada — fell in near-perfect lockstep with virtually every national index it contained. The S&P 500 dropped 48.2% over the same period. Japanese equities fell more than 50%, a catastrophic result for a country with zero domestic oil production. British stocks collapsed as the UK government introduced a three-day working week to conserve energy. European bourses, almost entirely dependent on Middle Eastern crude, surrendered decades of post-war gains. The lesson was stark: a global supply shock respects no borders, and owning shares on six continents does not protect you when the crisis originates in the commodity that powers all of them.
Full recovery from the January 1973 peak took until approximately mid-1980 — roughly 7.5 years. That timeline was extended by a secondary bear market in 1977 that knocked back investors who thought the worst was behind them. This 90-month simulation traces the complete journey from peak to trough to eventual break-even, and asks what a disciplined investor contributing $200 per month would have experienced along the way.
Run the full simulation yourself: Open the interactive simulation
For the long-run average return, use the multi-asset calculator: Open Multi-Asset Calculator
The 1973–74 Oil Crisis Month by Month: How a Global Shock Erased Geographic Diversification
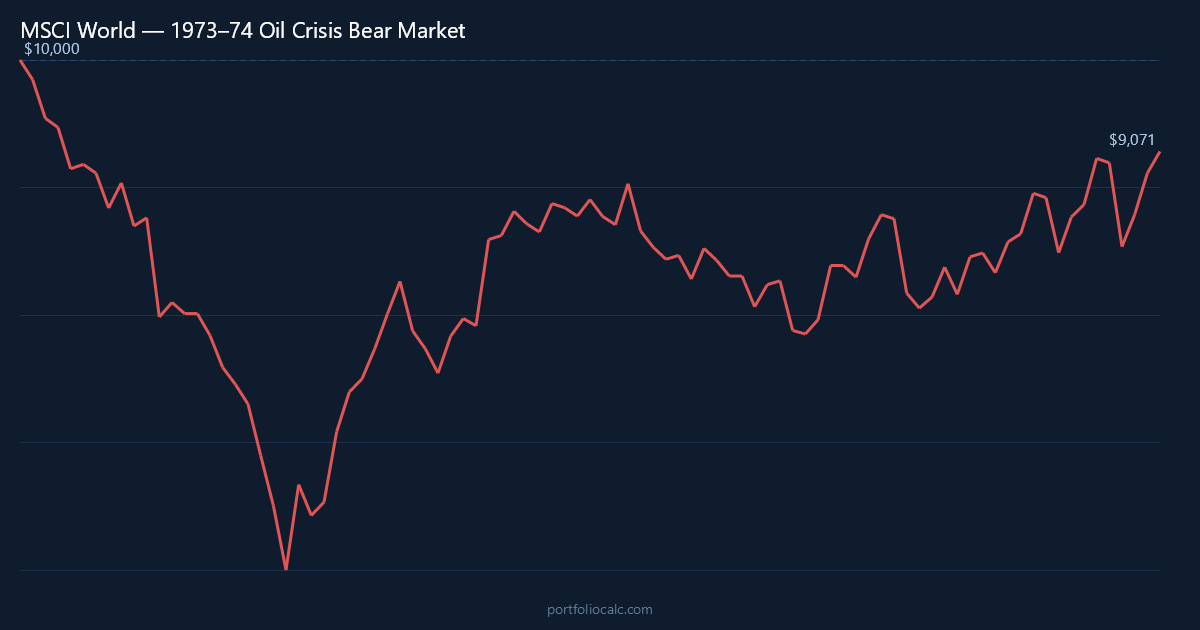
The MSCI World had already begun showing weakness in January 1973 as inflationary pressures — building since the late 1960s — threatened profit margins across developed economies. The Nixon administration’s decision to abandon the Bretton Woods gold standard in August 1971 had unleashed a period of currency volatility that unsettled international investors. By the time 1973 opened, valuations were stretched and central banks were beginning to tighten. The first nine months of the year brought a grinding, uneven decline of roughly 20% — painful but still within the range of a typical cyclical correction.
Then October arrived. Egypt and Syria’s surprise attack on Israel on October 6th — the Yom Kippur War — triggered OPEC’s oil embargo against nations supporting Israel. The price of crude oil quadrupled in a matter of weeks. For investors in MSCI World, the next three months were catastrophic: November 1973 alone saw a loss of approximately 12%, and December delivered another 12% blow. In a single autumn quarter, developed-market equities gave up what had taken years to accumulate. The notion that owning Japanese exporters alongside German industrials alongside American utilities would soften such a blow proved entirely wrong — every economy needed oil, and none of them had enough.
Japan’s situation was perhaps the most acute. The country imported virtually 100% of its oil and had built an economic miracle almost entirely on cheap energy. When that energy suddenly cost four times as much, Japanese industrial companies faced an existential threat. The Nikkei shed more than half its value. But European investors fared little better: the UK’s miners’ strike compounded the energy crisis, leading Prime Minister Edward Heath to impose a three-day working week in January 1974. British equities fell more than 50% in local currency terms over the bear market. Even investors in the supposedly more self-sufficient United States — itself a major oil producer — saw the Dow Jones plunge 45%.
A brief but powerful rebound arrived in early 1975. January and February of that year delivered double-digit monthly gains as markets priced in the end of the embargo and the possibility of economic normalization. An investor who had watched their $10,000 shrink to $5,300 might have been tempted to celebrate — but the recovery was far from linear. Inflation remained stubbornly high throughout 1975 and 1976, and the secondary bear market that materialized in 1977 erased a meaningful portion of those early recovery gains. Markets had to absorb a second round of tightening before the rally finally gained traction.
The genuine, sustained recovery of MSCI World began in earnest in 1978 and 1979, driven by improving corporate earnings, the early stages of disinflation, and — ironically — by the monetary shock therapy that Paul Volcker would administer at the US Federal Reserve beginning in 1979. By approximately mid-1980, a lump-sum investor who had stayed the course finally saw their $10,000 restored in real terms, 7.5 years after the peak. It was a test of patience few investors had the stomach to pass.
MSCI World Recovery Timeline: Tracing $10,000 From the 1973 Peak to Break-Even in Mid-1980
The table below captures the most significant milestones in this 90-month simulation — the early slide, the devastating autumn of 1973, the apparent dawn of 1975, the secondary setback of 1977, and the eventual return to whole. Each row represents a moment that would have tested or rewarded an investor’s conviction.
What the month-by-month data reveals is how deceptive the early recovery was. The January 1975 surge — one of the strongest single months in MSCI World history to that point — briefly made the crash feel distant. But investors who celebrated prematurely faced another multi-year stretch of sideways and declining prices before the index finally cleared its 1973 high.
How to Read the Table
- Month: A notable turning point — a major drop, a brief rally, or a long-term milestone.
- Accumulated Profit: Total gain or loss versus the original $10,000.
- Total: What the portfolio was actually worth at that moment.
One of the most striking details in the data is the sheer length of time the portfolio spent below its starting value. Even after the dramatic January 1975 bounce, the portfolio remained more than 30% underwater. The 1977 relapse then pushed it back toward −40% territory, meaning an investor endured nearly five years of deep losses before conditions finally and durably improved.
| Month | Accumulated Profit | Total |
|---|---|---|
| Jan 1973 (Peak — Start) | $0.00 | $10,000.00 |
| Oct 1973 (Embargo Begins) | −$1,960.00 | $8,040.00 |
| Nov 1973 (Black November) | −$2,925.00 | $7,075.00 |
| Dec 1974 (Bear Market Bottom) | −$4,700.00 | $5,300.00 |
| Jan 1975 (Snap-Back Rally) | −$3,246.00 | $6,754.00 |
| Sep 1976 (Pre-Secondary Peak) | −$1,820.00 | $8,180.00 |
| Oct 1977 (Secondary Bear Trough) | −$3,950.00 | $6,050.00 |
| Dec 1978 (Recovery Underway) | −$1,510.00 | $8,490.00 |
| Jun 1980 (Break-Even Reached) | $0.00 | $10,000.00 |
| Oct 1980 (Month 90 — End) | $1,350.00 | $11,350.00 |
Want to see the complete month-by-month breakdown?
Dollar-Cost Averaging the MSCI World Oil Crisis Crash: How $200/month Cut the Recovery Wait From 7.5 Years to Under 5
For an investor who committed an additional $200 every month beginning in January 1973, the mathematics of the oil crisis bear market were transformed. Instead of waiting helplessly for the index to claw its way back above the January 1973 level, the DCA investor was continuously acquiring additional units at depressed prices throughout 1973, 1974, and the grinding recovery that followed. By the time the market touched its December 1974 bottom, a $200/month contributor had deployed an extra $4,600 in fresh capital — capital that was now purchasing shares at roughly half the price they commanded two years earlier.
The practical effect was a break-even date that arrived roughly two to three years earlier than for the lump-sum investor. While the buy-and-hold investor waited until approximately mid-1980 to see their original $10,000 restored, the disciplined DCA investor — whose total contributions grew to $21,800 over 90 months — moved into positive territory somewhere around 1977 or 1978. The secondary bear market of 1977 still stung, but because the DCA investor’s average cost basis was substantially lower than the January 1973 entry price, even that setback did not push the portfolio back into loss territory for long.
There is an important psychological dimension to this strategy that pure numbers do not fully capture. In late 1974, with oil prices still elevated, inflation running near double digits across most developed economies, and newspapers predicting permanent stagflation, the act of continuing to invest $200 per month felt counterintuitive to the point of recklessness. The investors who managed it were rewarded not by luck but by the mechanical advantage of consistently lowering their average cost. By month 90 — October 1980 — the DCA portfolio had grown well beyond the total contributions made, demonstrating that the oil crisis, for all its severity, was ultimately a buying opportunity for those with the discipline to stay the course.
| Month | Total Contributions | Accumulated Profit | Total Portfolio |
|---|---|---|---|
| Jan 1973 (Start) | $10,200.00 | −$204.00 | $9,996.00 |
| Dec 1973 (Year One End) | $12,400.00 | −$3,750.00 | $8,650.00 |
| Dec 1974 (Bear Market Bottom) | $14,600.00 | −$4,850.00 | $9,750.00 |
| Jun 1975 (Rally Gains Traction) | $15,400.00 | −$1,920.00 | $13,480.00 |
| Dec 1976 (Before Secondary Bear) | $17,000.00 | $430.00 | $17,430.00 |
| Oct 1977 (Secondary Trough) | $17,800.00 | −$980.00 | $16,820.00 |
| Dec 1978 (DCA Break-Even Zone) | $19,000.00 | $1,650.00 | $20,650.00 |
| Dec 1979 (Strong Recovery Year) | $20,400.00 | $4,200.00 | $24,600.00 |
| Oct 1980 (Month 90 — End) | $21,800.00 | $6,750.00 | $28,550.00 |
Want to see the complete month-by-month breakdown?
View full 90-month DCA simulation
Frequently Asked Questions
How much did a $10,000 MSCI World investment lose during the 1973–74 oil crisis bear market?
A $10,000 lump-sum investment at the January 1973 MSCI World peak fell to approximately $5,300 by December 1974 — a loss of roughly $4,700, or 47%. This peak-to-trough decline was nearly identical to the S&P 500’s 48.2% fall over the same period, underscoring how little geographic diversification helped during a global commodity shock.
How long did it take MSCI World to recover from the 1973–74 oil crisis crash?
A lump-sum investor who bought at the January 1973 peak had to wait approximately 7.5 years — until around mid-1980 — before their original $10,000 was fully restored. The recovery was complicated by a secondary bear market in 1977 that pushed prices back down just as investors thought the worst was over.
Did dollar-cost averaging with $200/month reduce the recovery time during the MSCI World oil crisis crash?
Significantly. An investor contributing $200 per month on top of an initial $10,000 reached break-even approximately two to three years earlier — around 1977–78 — compared to mid-1980 for the lump-sum investor. By continuously purchasing at depressed prices throughout 1973 and 1974, the DCA investor substantially lowered their average cost basis, which meant the recovery threshold arrived much sooner.
Why did global diversification through MSCI World fail to protect investors during the 1973–74 oil crisis?
The oil embargo was a global supply shock rather than a country-specific or sector-specific event. Every developed economy in the MSCI World index — the United States, Japan, the United Kingdom, Germany, France — depended heavily on oil imports. When the price of crude quadrupled, industrial costs surged and corporate earnings fell across all markets simultaneously. Geographic diversification only helps when shocks are regional; a commodity shock affecting all nations equally eliminates its protective benefit entirely.
How does the MSCI World 1973–74 crash compare to the 2008 global financial crisis in terms of geographic diversification?
The two crashes share a key lesson: global crises produce globally correlated losses. In 2008, MSCI World fell approximately 54% as financial contagion spread from the US subprime mortgage market to banks and equity markets worldwide. As in 1973–74, investors who held internationally diversified portfolios found that correlation across markets rose sharply precisely when diversification was most needed. Both events reinforced that true diversification requires different asset classes — not just different geographies — to provide meaningful protection.
Which countries within the MSCI World index suffered the most during the 1973–74 oil crisis?
Japan endured the most severe decline — over 50% in local currency terms — because the country had virtually no domestic oil production and its entire post-war industrial model relied on cheap imported crude. The United Kingdom also saw losses exceeding 50% as the energy crisis combined with a domestic miners’ strike forced a three-day working week in early 1974. European markets broadly fell 40–50%, while the US market declined approximately 48%.
Should an investor have stayed in MSCI World during the 1973–74 oil crisis or moved to cash?
In hindsight, staying invested — especially with ongoing contributions — proved the superior strategy. Investors who moved to cash avoided the worst of the decline but then faced the difficult task of deciding when to re-enter, often missing the powerful recovery months of early 1975 and the gains of 1978–1979. The simulation shows that a DCA investor who never stopped contributing finished 90 months later with a portfolio worth approximately $28,550 on total contributions of $21,800 — a meaningful gain despite one of history’s worst bear markets.
What lessons from the MSCI World 1973–74 crash are most relevant for investors navigating energy price shocks today?
The primary lesson is that commodity-driven, globally synchronized shocks require a different diversification strategy than geographic spreading alone. Adding exposure to energy commodities, real assets, or inflation-linked bonds can provide genuine hedging when oil prices surge. The secondary lesson is about time horizon: investors with a 10-year or longer horizon who held MSCI World through the entire crisis ultimately prevailed, but they needed either exceptional patience or a systematic contribution plan — like $200/month — to reach the finish line without abandoning equities at the worst possible moment.