What If You Invested $10,000 in the Dow Jones Before the 2015–16 China Selloff?
How the 2015–16 China Selloff Turned $10,000 in the Dow Jones into $8,530 at the Bottom
The summer of 2015 caught most American investors off guard. China’s stock market had been in freefall since June, its currency devaluation rattled global confidence, and by August the shockwaves had crossed the Pacific with full force. The Dow Jones Industrial Average, long considered a steadier hand than the NASDAQ or even the S&P 500, dropped 14.7% from its May 2015 peak to its February 2016 trough — a decline that turned a $10,000 lump-sum investment into roughly $8,530 at the worst moment. That’s not a catastrophic wipeout by historical standards, but it was painful enough to shake investor confidence across two calendar years.
What made this particular drawdown distinctive was the composition of the Dow itself. Unlike the NASDAQ’s tech-heavy roster, the Dow’s 30 blue-chip components included industrial giants with deep manufacturing ties to China — Caterpillar, 3M, and DuPont among them — as well as energy majors Chevron and ExxonMobil that were simultaneously battered by collapsing crude oil prices. The index that investors often think of as a defensive anchor turned out to have meaningful direct exposure to the exact pressures China was exporting to the world.
This simulation tracks a $10,000 investment placed at the May 2015 peak through 24 months, capturing the August flash crash, the January 2016 second wave, the gradual recovery, and the explosive post-election Trump rally that finally pushed the Dow to new records in late 2016.
Run the full simulation yourself: Open the interactive simulation
For the long-run average return, use the multi-asset calculator: Open Multi-Asset Calculator
The Dow Jones China Selloff Month by Month: Flash Crashes, False Floors, and a Long Road Back
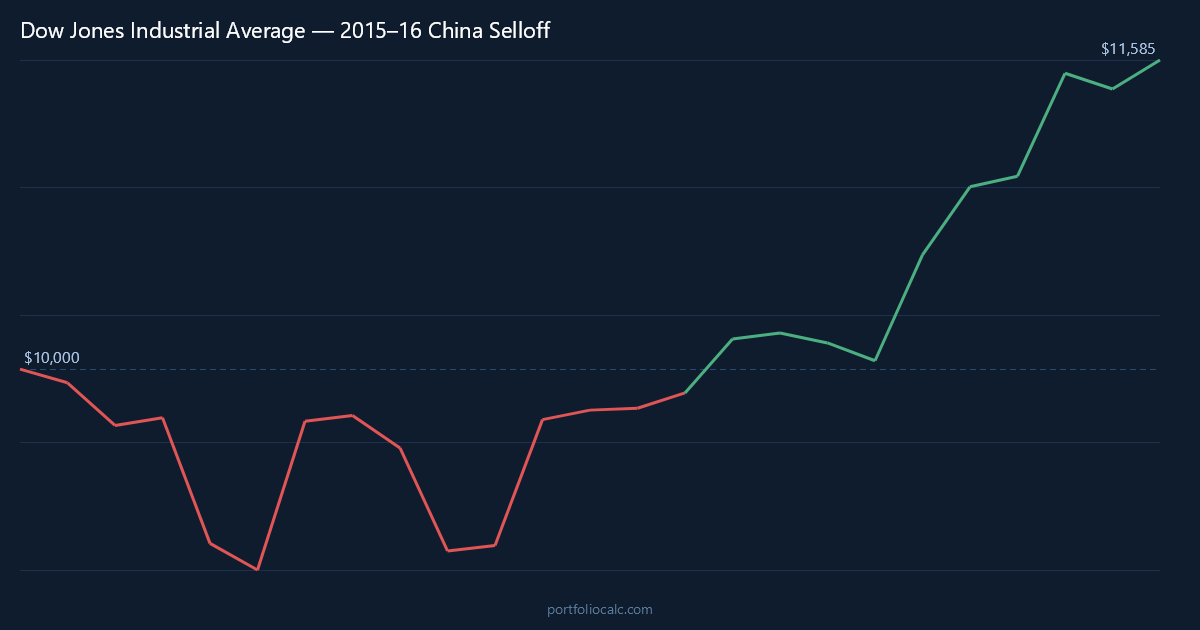
The Dow’s decline began quietly. May and June 2015 brought modest losses as China’s equity bubble started deflating, and investors largely assumed the turbulence would stay contained to emerging markets. The first real warning sign came in July with a 6.6% drop — the index’s sharpest monthly fall in years — as the scale of China’s economic deceleration became impossible to ignore. Commodity demand was evaporating, and the Dow’s industrial components felt it immediately.
Then came August 24, 2015 — a date that Dow watchers still discuss. On that Monday morning, the index fell more than 1,000 points at the open in what became one of the most dramatic single-day openings in its history. Boeing, a high-priced stock that carries outsized influence in the Dow’s price-weighted calculation, opened down roughly 18%. Because the Dow weights companies by share price rather than market cap, a violent move in a high-priced name like Boeing can shift the entire index far more than its market significance might suggest. That structural quirk made August 2015 hit the Dow disproportionately hard compared to other major indices.
September 2015 brought a brief glimmer of hope. The Federal Reserve, widely expected to begin hiking rates, stood pat at its September meeting, citing global uncertainty. Markets interpreted this as support, and the Dow bounced back with an 8.5% gain in October — one of its strongest monthly recoveries in the post-crisis era. Investors who had been watching from the sidelines started wondering if the bottom was in. It wasn’t.
The second wave arrived in January 2016. China’s new stock market circuit breakers — designed to halt trading during sharp declines — backfired spectacularly, triggering panic selling every time they activated. Oil prices continued to slide, dragging Chevron and ExxonMobil lower and compounding the pressure on the Dow. By February 2016, the index had reached its true trough, with a $10,000 investment now worth approximately $8,530. The double-dip nature of this selloff — a hard drop in August followed by a second decline in January — was psychologically punishing for investors who had held on expecting a clean recovery.
The road back proved slow and uneven by Dow standards. Through the spring and summer of 2016, the index ground higher in fits and starts. Brexit briefly knocked it sideways in June before buyers stepped back in. It wasn’t until the November 2016 U.S. presidential election — and the market’s enthusiastic embrace of anticipated infrastructure spending, deregulation, and tax cuts — that the Dow surged decisively. The so-called “Trump rally” sent the index up 5.4% in November alone, and lump-sum investors who had entered at the May 2015 peak finally crossed back to break-even in September 2016, roughly 16 months after the top.
Dow Jones China Selloff Recovery Timeline: Tracking $10,000 from Peak to Break-Even
The table below traces a $10,000 lump-sum investment placed at the Dow’s May 2015 high through the most consequential turning points of the 24-month simulation. Each row marks a moment that mattered — whether a sharp leg down, a head-fake recovery, or a genuine shift in momentum.
What the numbers reveal is a crash that played out in two distinct acts separated by a deceptive October 2015 rally. Investors who interpreted that bounce as a full recovery and reduced their positions missed the January 2016 second wave entirely. The data also illustrates how the Trump rally did heavy lifting in the final stretch, compressing a recovery that might otherwise have stretched well into 2017.
How to Read the Table
- Month: A notable turning point — a major drop, a brief rally, or a long-term milestone.
- Accumulated Profit: Total gain or loss versus the original $10,000.
- Total: What the portfolio was actually worth at that moment.
Notice how the October 2015 surge brought the portfolio back to within striking distance of break-even — only for the January 2016 selloff to erase those gains and push the portfolio to its lowest point of the entire simulation in February 2016.
| Month | Accumulated Profit | Total |
|---|---|---|
| May 2015 (Peak — Entry Point) | $0.00 | $10,000.00 |
| Jun 2015 (Early Weakness) | -$220.00 | $9,780.00 |
| Aug 2015 (China Shock & Flash Crash) | -$888.00 | $9,112.00 |
| Oct 2015 (Fed Pause — False Dawn) | -$114.00 | $9,886.00 |
| Jan 2016 (Second Wave Begins) | -$1,051.00 | $8,949.00 |
| Feb 2016 (Bottom) | -$1,470.00 | $8,530.00 |
| Apr 2016 (Gradual Recovery) | -$1,178.00 | $8,822.00 |
| Sep 2016 (Break-Even) | $0.00 | $10,000.00 |
| Nov 2016 (Trump Rally Surge) | +$645.00 | $10,645.00 |
| Apr 2017 (Simulation End) | +$1,090.00 | $11,090.00 |
Want to see the complete month-by-month breakdown?
Dollar-Cost Averaging the Dow Jones China Selloff: How $200/month Reached Break-Even 8 Months Early
For investors who kept adding money throughout the 2015–16 selloff, the outcome was dramatically different. By contributing $200 every month on top of the initial $10,000, a disciplined investor was able to accumulate Dow shares at depressed prices during the August 2015 plunge, the autumn plateau, and the January 2016 second dip. Each contribution bought a slightly larger slice of the index at a lower price, reducing the effective cost basis of the entire portfolio with every passing month.
The mechanical advantage of dollar-cost averaging (DCA) during this particular crash was amplified by the double-dip structure of the selloff. Most of the worst months — August 2015, September 2015, January 2016, and February 2016 — were spread across nearly nine months, giving a monthly contributor multiple opportunities to buy at distressed prices rather than just one. By the time the Dow began its genuine recovery in the spring of 2016, the DCA investor held far more shares at a far lower average cost than someone who had invested everything in May 2015 and held on.
The result: the DCA portfolio reached break-even in approximately January 2016 — while the lump-sum investor was still nursing a loss of over $1,000. That’s an eight-month head start on the road to recovery, achieved simply by staying consistent and letting the math work. By the end of the 24-month simulation, the DCA investor had contributed a total of $14,800 ($10,000 initial plus $200 × 24 months) and held a portfolio worth approximately $16,300 — a gain of roughly $1,500 over total contributions.
| Month | Total Contributions | Accumulated Profit | Total Portfolio |
|---|---|---|---|
| May 2015 (Entry) | $10,200.00 | -$70.00 | $10,130.00 |
| Aug 2015 (Flash Crash Month) | $10,800.00 | -$723.00 | $10,077.00 |
| Oct 2015 (Fed Pause Rally) | $11,200.00 | +$186.00 | $11,386.00 |
| Jan 2016 (DCA Break-Even Zone) | $11,800.00 | +$12.00 | $11,812.00 |
| Feb 2016 (Lump-Sum Bottom) | $12,000.00 | -$218.00 | $11,782.00 |
| May 2016 (Recovery Builds) | $12,600.00 | +$410.00 | $13,010.00 |
| Sep 2016 (Lump-Sum Break-Even) | $13,400.00 | +$832.00 | $14,232.00 |
| Nov 2016 (Trump Rally) | $13,800.00 | +$1,185.00 | $14,985.00 |
| Apr 2017 (Simulation End) | $14,800.00 | +$1,502.00 | $16,302.00 |
Want to see the complete month-by-month breakdown?
View full 24-month DCA simulation
Frequently Asked Questions
How much did a $10,000 Dow Jones investment lose during the 2015–16 China selloff?
A $10,000 lump-sum investment placed at the Dow’s May 2015 peak declined to approximately $8,530 at the February 2016 trough — a loss of roughly $1,470, or about 14.7%. While painful, this was significantly shallower than the Dow’s losses during the 2008 financial crisis or the dot-com bust, which exceeded 30% and 35% respectively.
How long did it take for the Dow Jones to recover to break-even after the China selloff?
A lump-sum investor who bought at the May 2015 peak reached break-even in approximately September 2016 — about 16 months later. The recovery was gradual through most of 2016 and was meaningfully accelerated by the post-election Trump rally in November 2016, which added 5.4% in a single month.
Why did the Dow Jones fall so hard during the 2015 China selloff despite being seen as a defensive index?
The Dow’s 30 components included several companies with direct exposure to China’s manufacturing slowdown, including Caterpillar, 3M, and DuPont. Simultaneously, Chevron and ExxonMobil were hammered by oil prices collapsing alongside Chinese demand. The index’s price-weighted structure also amplified the impact of Boeing’s 18% opening drop on August 24, 2015, since high-priced stocks move the Dow more than lower-priced ones regardless of market cap.
How did Dollar-Cost Averaging $200/month compare to a lump-sum investment during the Dow’s 2015–16 selloff?
The DCA approach reached break-even approximately eight months earlier than the lump-sum strategy — around January 2016 versus September 2016. By the end of the 24-month simulation, the DCA investor held a portfolio worth roughly $16,300 against total contributions of $14,800, a gain of about $1,500. The double-dip structure of the selloff was particularly well-suited to DCA, offering multiple buying opportunities at depressed prices.
What caused the second wave of selling in the Dow Jones in January 2016?
China’s newly introduced stock market circuit breakers backfired badly in early January 2016, triggering automatic trading halts that amplified panic rather than containing it. Combined with continued weakness in oil prices and fresh anxiety about China’s currency management, the Dow dropped sharply again — just months after what many investors hoped was a completed correction. This second leg down pushed the index to its true bottom in February 2016.
How does the Dow Jones 2015–16 China selloff compare to other major Dow crashes?
At 14.7% peak-to-trough, the China selloff was a mid-tier correction by Dow standards — far smaller than the 54% decline during the 2008–09 financial crisis or the 38% drop in the dot-com era. However, it was notably deeper than the brief 2018 corrections and more prolonged than the COVID crash of 2020, which recovered within months. The 16-month path to break-even placed it squarely in the category of a meaningful but survivable drawdown.
Should an investor have bought more Dow Jones shares during the August 24, 2015 flash crash?
In hindsight, yes — the August 24 opening selloff represented one of the more extreme intraday dislocations in recent Dow history. Many blue-chip stocks briefly traded at prices far below their intrinsic value due to cascading stop-loss orders and ETF mispricings at the open. Investors who placed limit buy orders before the open or bought in the first 30 minutes of trading captured prices that weren’t available again for months. That said, such moves require both capital reserves and psychological discipline that few investors maintain during a panic.
What lessons from the Dow Jones 2015–16 China selloff apply to today’s investors?
Several lessons stand out. First, “blue chip” does not mean “immune to global shocks” — the Dow’s industrial and energy components proved just as vulnerable as broad market indices. Second, the index’s price-weighted structure can amplify single-stock moves in ways that market-cap-weighted indices do not. Third, the DCA data shows clearly that maintaining contributions during a downturn dramatically improves long-run outcomes. And finally, the Trump rally illustrated how quickly an external catalyst can compress a slow, grinding recovery into a sharp surge — timing it is nearly impossible, which is one more argument for staying invested.