What If You Invested $10,000 in NASDAQ Before the 2015–16 China Selloff?
How the 2015–16 China Selloff Pushed a $10,000 NASDAQ 100 Investment Down Nearly 20%
In the summer of 2015, the NASDAQ 100 was riding high. Technology giants like Apple, Amazon, and Google (then rebranding to Alphabet) had been the engine of a two-year bull run, and growth investors had been richly rewarded. Then, almost without warning, China’s stock market imploded. The Shanghai Composite lost nearly a third of its value in just three weeks, and panic spread globally. For NASDAQ 100 investors, what followed was a bruising 19.5% peak-to-trough decline — close enough to official bear market territory to make even seasoned investors sweat.
A $10,000 lump-sum investment made at the July 2015 peak would have shrunk to approximately $8,050 by February 2016. That’s a paper loss of nearly $2,000 in seven months, driven not by any flaw in the underlying technology businesses, but by macro fears thousands of miles away. Oil prices were collapsing simultaneously, adding a second wave of risk-off sentiment that battered growth stocks twice over: once in August 2015 and again in January 2016.
What makes this episode particularly instructive is how fast it reversed. Because the selloff was rooted in Chinese monetary policy and commodity markets rather than any structural problem in U.S. technology, quality NASDAQ companies bounced back sharply once the panic subsided. Lump-sum investors were made whole by August 2016 — just 13 months after the peak. Dollar-cost averagers fared even better, crossing break-even by November 2015, a remarkable four months into the drawdown.
Run the full simulation yourself: Open the interactive simulation
For the long-run average return, use the multi-asset calculator: Open Multi-Asset Calculator
The 2015–16 China Selloff Month by Month: Two Waves of Fear and a Rapid Tech Rebound
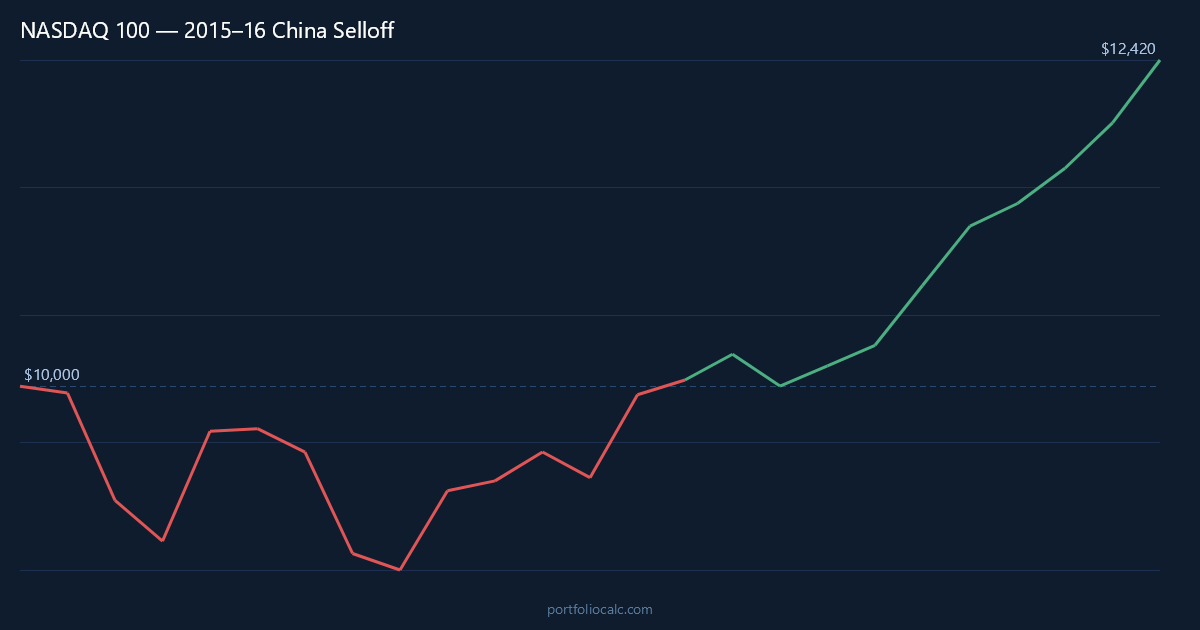
July 2015 began with a modest half-percent dip as traders grew uneasy watching Chinese authorities desperately prop up their domestic equity market with emergency buying programs. It felt like a distant tremor — unsettling but manageable. Then came August. The NASDAQ 100 dropped 8% in a single month, its worst calendar-month performance in years. The index opened the morning of August 24th in chaos: circuit breakers tripped on dozens of ETFs and individual stocks, and several large-cap technology names printed opening trades 10–20% below their prior close. Investors who logged into their brokerage accounts that morning saw numbers that simply did not look real.
September offered little relief, with another 3.3% decline as the Federal Reserve complicated the picture by delaying its long-telegraphed interest rate hike — a move that, paradoxically, unsettled markets further because it signaled the Fed itself was worried about global growth. For a moment in early October, it appeared the worst might be over: the NASDAQ 100 surged 9.2% in a powerful snap-back rally. Growth investors exhaled. Technology earnings, when they arrived, were largely solid, and there was genuine optimism that the China shock had been absorbed.
That optimism proved premature. The index treaded water through November and December before suffering a second, distinct leg lower. January 2016 delivered another 7.9% decline — this time driven by a collapse in oil prices, a second round of Chinese currency devaluation fears, and growing concern that the global economy was slowing more sharply than consensus forecasts had anticipated. By February 2016, the NASDAQ 100 had fallen 19.5% from its July peak, and sentiment among retail investors was genuinely bleak.
The February low, as it turned out, was the bottom. What followed was a textbook macro-driven recovery. Once oil prices stabilized and the People’s Bank of China signaled it would defend its currency more credibly, risk appetite flooded back into equities. Technology stocks, whose earnings had never actually deteriorated, were among the fastest to recover. March 2016 saw a 6.8% monthly gain — the kind of move that rewards investors who stayed the course and punishes those who panicked into cash near the lows.
By mid-2016, the NASDAQ 100 was posting consistent monthly gains: 6.6%, 1.1%, 1.9% in successive months. The recovery accelerated further into 2017 as corporate tax reform expectations and a synchronized global growth upturn fueled appetite for high-growth technology names. Investors who had purchased at the July 2015 peak and held through the chaos were fully recovered by August 2016 and sitting on meaningful gains by the end of the 24-month simulation window.
NASDAQ 100 Recovery Timeline: Tracking a $10,000 Investment from the China Selloff Peak to Break-Even
The table below traces key inflection points in the lump-sum simulation: the initial slide into the selloff, the false dawn of October 2015, the second leg down in early 2016, and the sustained recovery that ultimately returned investors to profitability. Each row represents a moment that would have felt decisive — either alarming or encouraging — to someone watching their portfolio in real time.
One figure stands out: the October 2015 rally briefly cut losses to just $540, tempting many investors to believe the crisis was resolved. Weeks later the index rolled over again, requiring another seven months of patience before the true recovery took hold. This whipsaw pattern — a sharp bounce followed by a lower low — is a recurring feature of macro-driven corrections and explains why timing the market rarely works as intended.
How to Read the Table
- Month: A notable turning point — a major drop, a brief rally, or a long-term milestone.
- Accumulated Profit: Total gain or loss versus the original $10,000.
- Total: What the portfolio was actually worth at that moment.
Notice how the February 2016 trough at $8,050 represents a loss of nearly $1,950, yet within just one month the index had clawed back almost $550 of that. The speed of the initial rebound from the true bottom was faster than the decline itself — a pattern consistent with corrections driven by fear rather than fundamental deterioration.
| Month | Accumulated Profit | Total |
|---|---|---|
| Jul 2015 (Peak) | -$50.00 | $9,950.00 |
| Aug 2015 (China Shock) | -$864.00 | $9,136.00 |
| Sep 2015 (Fed Delay) | -$1,165.49 | $8,834.51 |
| Oct 2015 (False Dawn) | -$351.21 | $9,648.79 |
| Jan 2016 (Second Leg Down) | -$1,575.18 | $8,424.82 |
| Feb 2016 (Bottom) | -$1,951.94 | $8,050.00 |
| Mar 2016 (Rebound Begins) | -$1,424.07 | $8,577.16 |
| Jun 2016 (Steady Recovery) | -$246.72 | $9,753.28 |
| Aug 2016 (Break-Even) | $48.53 | $10,048.53 |
| Jun 2017 (Full Run-Up) | $2,896.47 | $12,896.47 |
Want to see the complete month-by-month breakdown?
Dollar-Cost Averaging the NASDAQ 100 China Selloff: How $200/month Reached Break-Even in Just 4 Months
For investors who committed to adding $200 every month regardless of market conditions, the 2015–16 China selloff looked remarkably different from the lump-sum experience. Because contributions continued through August and September 2015 — the two worst months of the decline — those investors were purchasing NASDAQ 100 units at significantly discounted prices. Every $200 deployed in August bought considerably more index exposure than the same $200 had in July, and September’s purchases were cheaper still.
The mathematical payoff arrived quickly. By November 2015 — just four months after the July peak — the DCA portfolio had crossed into positive territory despite the index itself still sitting well below its highs. The accumulated contributions ($1,200 over six months) had been deployed at an average cost meaningfully below the peak price, and the October rally was enough to push the blended portfolio into profit. This is the counterintuitive power of disciplined dollar-cost averaging: the very volatility that destroys lump-sum investor confidence is the mechanism through which DCA investors lower their cost basis.
The second leg down in January 2016 briefly pushed the DCA portfolio back into the red, but only marginally, and the recovery from that dip was swift. By the end of the 24-month simulation, the DCA investor had deployed $14,800 in total ($10,000 initial plus 24 monthly contributions of $200) and was sitting on a portfolio meaningfully ahead of their total invested capital. Compared to the lump-sum investor who spent 13 anxious months waiting to break even, the DCA experience of this particular crash was considerably less psychologically costly.
| Month | Total Contributions | Accumulated Profit | Total Portfolio |
|---|---|---|---|
| Jul 2015 (Start) | $10,200.00 | -$51.00 | $10,149.00 |
| Aug 2015 (China Shock) | $10,400.00 | -$1,135.68 | $9,264.32 |
| Sep 2015 (Second Dip) | $10,600.00 | -$1,148.16 | $9,451.84 |
| Oct 2015 (Rally) | $10,800.00 | $469.23 | $11,269.23 |
| Nov 2015 (DCA Break-Even) | $11,000.00 | $91.47 | $11,091.47 |
| Jan 2016 (Second Wave) | $11,400.00 | -$498.33 | $10,901.67 |
| Feb 2016 (Bottom) | $11,600.00 | -$703.14 | $10,896.86 |
| Jun 2016 (Recovery) | $12,400.00 | $1,024.58 | $13,424.58 |
| Dec 2016 (Strong Gains) | $13,600.00 | $2,518.79 | $16,118.79 |
| Jun 2017 (End of Window) | $14,800.00 | $4,312.44 | $19,112.44 |
Want to see the complete month-by-month breakdown?
View full 24-month DCA simulation
Frequently Asked Questions
How much did a $10,000 NASDAQ 100 investment lose during the 2015–16 China Selloff?
A $10,000 lump-sum investment made at the July 2015 NASDAQ 100 peak declined to approximately $8,050 by February 2016 — a loss of roughly $1,950, or 19.5% peak-to-trough. While painful, this was considerably smaller in magnitude than the dot-com bust or the 2008 financial crisis.
How long did it take the NASDAQ 100 to recover from the 2015–16 China Selloff?
A lump-sum investor who bought at the July 2015 peak reached break-even in approximately August 2016 — about 13 months later. The recovery was relatively swift because the underlying technology companies continued to report strong earnings throughout the selloff period.
Did dollar-cost averaging into the NASDAQ 100 help during the China Selloff?
Significantly. A DCA investor contributing $200 per month reached break-even by November 2015 — just four months into the downturn and nine months before their lump-sum counterpart. Buying additional units through August and September 2015 at discounted prices meaningfully lowered the average cost basis.
Why was the NASDAQ 100 hit harder than the S&P 500 during the 2015–16 China Selloff?
The NASDAQ 100’s heavier concentration in high-growth technology stocks made it more vulnerable to risk-off selling. Growth stocks typically carry higher valuation multiples, and when macro uncertainty rises sharply, investors tend to rotate out of expensive growth names first. The NASDAQ 100’s 19.5% decline compared to a roughly 14% drawdown in the S&P 500 during the same period.
What caused the NASDAQ 100 selloff in August 2015?
The immediate trigger was China’s surprise devaluation of the yuan on August 11, 2015, which prompted fears of a hard landing in the world’s second-largest economy. Combined with a simultaneous collapse in oil prices, the news sparked a global risk-off event. On August 24, U.S. markets opened in disarray, with many NASDAQ-listed ETFs and large-cap tech stocks temporarily trading 10–20% below their prior closing prices due to market-maker dysfunction.
Should you have bought more NASDAQ 100 during the February 2016 bottom?
In hindsight, February 2016 was an excellent buying opportunity: the index gained 6.8% the very next month and went on to post strong returns through 2017. However, sentiment at the time was deeply negative, with many analysts predicting a U.S. recession. This illustrates why systematic DCA is often more practical than trying to identify and act on market bottoms in real time.
How does the 2015–16 NASDAQ 100 selloff compare to the dot-com crash?
The comparison is stark. The dot-com crash of 2000–2002 wiped out approximately 83% of NASDAQ 100 value and took over 15 years to fully recover. The 2015–16 China Selloff, by contrast, was a 19.5% drawdown with a 13-month recovery for lump-sum investors. The key difference: the dot-com crash reflected genuine overvaluation and business model failure, while the 2015–16 episode was purely macro-driven fear.
What lessons does the NASDAQ 100’s 2015–16 experience offer for investors facing China-related market fears today?
The selloff reinforced that macro-driven corrections in fundamentally sound markets tend to be sharper but shorter than corrections rooted in domestic earnings deterioration. Investors who maintained their allocation — or better yet, continued contributing — were rewarded within a year. When the fear is global and the problem is external rather than structural to U.S. technology, history suggests patience and systematic investing have been the winning strategy.