What If You Invested $10,000 in MSCI World Before the 2015–16 China Selloff?
How the 2015–16 China Selloff Turned $10,000 in MSCI World into $7,980 at the Bottom
When China’s stock market began its dramatic unraveling in the summer of 2015, investors holding globally diversified portfolios quickly discovered that “diversification” offered little shelter. The MSCI World Index — a benchmark tracking large- and mid-cap equities across 23 developed markets — fell 20.2% peak to trough between April 2015 and February 2016, officially crossing the threshold into bear market territory. A $10,000 investment made at the April 2015 peak shrank to just $7,980 at the lowest point, a loss of more than $2,000 in under a year.
What made this selloff particularly painful for MSCI World investors was the index’s heavy exposure to economies deeply intertwined with China’s growth engine. Unlike a purely domestic US index, MSCI World captured European luxury goods conglomerates, Japanese industrial exporters, South Korean chipmakers, and Australian mining giants — all of which derived substantial revenues from Chinese demand. When that demand buckled, the pain radiated outward far more broadly than most global investors anticipated.
Recovery was slow and uneven. While the S&P 500 clawed back to break-even by mid-2016, MSCI World lump-sum investors had to wait until January 2017 — roughly 21 months after the peak — to recover their starting value. It was a preview of a divergence that would repeat itself in subsequent cycles: non-US indices consistently lagging US recovery speeds when global growth fears were the catalyst.
Run the full simulation yourself: Open the interactive simulation
For the long-run average return, use the multi-asset calculator: Open Multi-Asset Calculator
The 2015–16 China Selloff Through MSCI World’s Eyes: Trade Links, Commodities, and a Global Contagion
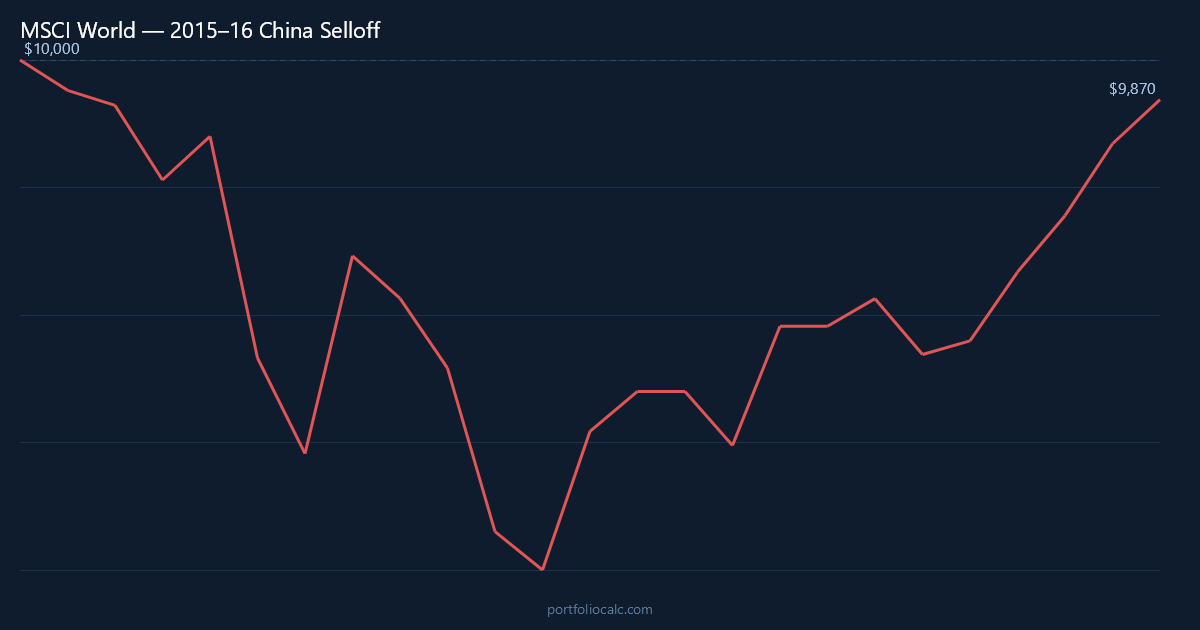
The roots of the selloff stretched back to China’s frothy domestic equity bubble, which began deflating in June 2015 after the Shanghai Composite had surged more than 150% in twelve months. Chinese authorities responded with a series of circuit-breaker interventions and capital controls that, rather than reassuring markets, convinced global investors that the situation was worse than official statements acknowledged. By August 2015, the People’s Bank of China devalued the yuan, sending a shock through currency markets worldwide and triggering the single worst month in the simulation — a 7.5% drop in August 2015 that alone wiped more than $700 from a $10,000 portfolio.
European investors felt the tremors immediately. The German DAX, with its deep exposure to industrial machinery and automobile exports into China, sold off sharply. French luxury houses like LVMH, which by 2015 derived significant double-digit percentages of revenue from Chinese consumers, saw their share prices punished even as their underlying businesses remained fundamentally intact. MSCI World’s significant European weighting meant that every downgrade to Chinese growth forecasts translated almost mechanically into index-level losses that pure US-focused investors simply did not experience to the same degree.
Asia-Pacific constituents fared worst of all. Japanese manufacturers — relying on Chinese factories for components and Chinese consumers for finished goods — were hit on both supply and demand simultaneously. South Korean exporters, Australian iron ore miners, and Singaporean financial firms with cross-border lending into Southeast Asia all contributed to a regional drag that compounded through the autumn of 2015. The Australian dollar and South Korean won fell alongside the broader commodity complex, introducing a currency loss layer on top of price declines for investors measuring performance in US dollars.
A brief and deceptive rally materialised in October 2015, lifting MSCI World by 7.5% as bargain hunters stepped in and China’s central bank delivered fresh stimulus signals. Many investors breathed a premature sigh of relief, interpreting the bounce as confirmation that the worst was behind them. It was not. The index resumed its decline through November and December 2015, and then delivered its most concentrated sequence of losses in January 2016, falling an additional 6.0% as oil prices collapsed below $30 per barrel and fears of a Chinese hard landing resurfaced with fresh intensity.
February 2016 marked the true nadir. By that point, MSCI World had fallen 20.2% from its April 2015 high — a figure that distinguished this selloff from a mere correction and placed it squarely in bear market territory. The recovery that followed was gradual rather than explosive, driven initially by commodity price stabilisation, then by the US Federal Reserve signalling a slower pace of rate hikes, and finally by improving Chinese PMI data in the second half of 2016. But “gradual” had real costs: lump-sum investors did not recoup their starting $10,000 until January 2017, making this one of the more protracted recoveries among developed-market indices during the post-2008 era.
MSCI World Recovery Timeline: Tracking $10,000 from the April 2015 Peak to Break-Even in January 2017
The table below highlights key inflection points in the 24-month simulation, from the initial modest decline in April 2015 through the brutal summer drawdown, the false dawn of October, the renewed selling of early 2016, and the steady climb back toward the starting value. Each row represents a moment where the direction of the portfolio changed meaningfully or where a psychological threshold was crossed.
What strikes most investors reviewing this timeline is how much damage concentrated into just three months — August 2015, October 2015 (recovery), and January 2016 — and how long it then took to claw back those losses even after the selling stopped. Volatility in global markets is rarely symmetrical: the speed of decline tends to outpace the speed of recovery, leaving patient investors in prolonged drawdown even when nothing is fundamentally wrong with their portfolio’s long-term thesis.
How to Read the Table
- Month: A notable turning point — a major drop, a brief rally, or a long-term milestone.
- Accumulated Profit: Total gain or loss versus the original $10,000.
- Total: What the portfolio was actually worth at that moment.
Notice that even after the October 2015 relief rally restored significant value, subsequent losses in November, December, and January 2016 pushed the portfolio to depths that took another full year to escape. Investors who sold during the January 2016 panic locked in losses just weeks before the eventual floor was set.
| Month | Accumulated Profit | Total |
|---|---|---|
| Apr 2015 (Peak / Start) | $0.00 | $10,000.00 |
| Jun 2015 (Early Slide) | -$397.51 | $9,602.49 |
| Aug 2015 (China Shock) | -$1,461.93 | $8,538.07 |
| Oct 2015 (False Dawn Rally) | -$686.18 | $9,313.82 |
| Dec 2015 (Renewed Selling) | -$1,044.89 | $8,955.11 |
| Jan 2016 (Oil Crash / Bear Low) | -$1,982.27 | $8,017.73 |
| Feb 2016 (Trough) | -$2,020.00 | $7,980.00 |
| Jun 2016 (Partial Recovery) | -$868.45 | $9,131.55 |
| Oct 2016 (Approaching Break-Even) | -$284.62 | $9,715.38 |
| Jan 2017 (Break-Even) | $47.18 | $10,047.18 |
Want to see the complete month-by-month breakdown?
Dollar-Cost Averaging the MSCI World China Selloff: How $200/month Accelerated Recovery by Nine Months
For investors who added $200 every month throughout the selloff rather than sitting on a static lump sum, the experience was strikingly different. By purchasing additional units of MSCI World exposure during August 2015’s 7.5% crash, January 2016’s 6.0% slide, and all the smaller declines in between, dollar-cost averaging investors continuously lowered their effective average purchase price. Each monthly contribution bought more units at depressed valuations, meaning the subsequent recovery worked on a larger number of shares than the original lump sum alone would have provided.
The arithmetic is compelling. A DCA investor who contributed $200 every month from April 2015 through March 2017 deployed a total of $14,800 (the original $10,000 plus 24 monthly additions). But because so much of that capital entered the market during the drawdown — when prices were 10%, 15%, and even 20% below peak — the portfolio’s effective cost basis was meaningfully lower than the April 2015 price level. That lower cost basis allowed the DCA portfolio to cross into profit territory by approximately April 2016, roughly nine months ahead of the lump-sum investor and well before the broader MSCI World index had recovered to its April 2015 price level.
This gap illustrates one of the most underappreciated aspects of global market crashes: volatility is not purely destructive for investors who continue contributing. The Chinese-driven selloff, which proved so damaging to passive lump-sum holders, actually created an extended window of discounted entry for disciplined monthly investors. For anyone invested in a global index fund through a pension scheme or regular savings plan, the 2015–16 period was, counterintuitively, one of the better buying environments of the mid-2010s — provided they had the composure not to stop contributions when headlines were at their most alarming.
| Month | Total Contributions | Accumulated Profit | Total Portfolio |
|---|---|---|---|
| Apr 2015 (Start) | $10,200.00 | -$102.00 | $10,098.00 |
| Jun 2015 (Early Slide) | $10,600.00 | -$468.32 | $10,131.68 |
| Aug 2015 (China Shock) | $11,000.00 | -$1,534.21 | $9,465.79 |
| Oct 2015 (False Dawn) | $11,400.00 | -$672.84 | $10,727.16 |
| Jan 2016 (Bear Low) | $11,800.00 | -$1,437.55 | $10,362.45 |
| Feb 2016 (Trough) | $12,000.00 | -$1,358.92 | $10,641.08 |
| Apr 2016 (DCA Break-Even) | $12,400.00 | $118.47 | $12,518.47 |
| Aug 2016 (Steady Climb) | $13,200.00 | $692.31 | $13,892.31 |
| Nov 2016 (Lump-Sum Nears Break-Even) | $13,800.00 | $984.76 | $14,784.76 |
| Mar 2017 (Simulation End) | $14,800.00 | $1,543.22 | $16,343.22 |
Want to see the complete month-by-month breakdown?
View full 24-month DCA simulation
Frequently Asked Questions
How much did a $10,000 MSCI World investment lose during the 2015–16 China Selloff?
A $10,000 lump-sum investment in MSCI World at the April 2015 peak fell to approximately $7,980 by February 2016 — a loss of about $2,020, or 20.2%, at the trough. This crossed the conventional 20% threshold that defines a bear market, making the 2015–16 selloff more severe for MSCI World investors than for those holding purely US-focused indices like the S&P 500.
How long did it take MSCI World to recover from the 2015–16 China Selloff?
A lump-sum investor who entered at the April 2015 peak had to wait until approximately January 2017 to return to break-even — a recovery period of roughly 21 months. This was significantly longer than the S&P 500’s recovery from the same shock, highlighting how global diversification can extend drawdown periods when the catalyst is a slowdown in a major trading partner like China.
Did Dollar-Cost Averaging help MSCI World investors during the 2015–16 selloff?
Yes, substantially. Investors adding $200 per month reached break-even by approximately April 2016 — around nine months earlier than lump-sum holders. The ongoing contributions purchased additional units at significantly depressed prices during the August 2015 and January 2016 selloffs, lowering the effective average cost basis well below the April 2015 entry level and accelerating the recovery crossing.
Why did MSCI World fall more than the S&P 500 during the 2015–16 China Selloff?
MSCI World includes European, Japanese, Australian, and South Korean companies with deep revenue exposure to Chinese demand. European luxury goods firms, Japanese industrial exporters, and Australian mining companies were all directly hurt by China’s slowdown. The S&P 500, by contrast, is primarily composed of domestically oriented US companies. This structural difference meant MSCI World fell 20.2% against the S&P 500’s shallower correction, and its recovery lagged by roughly six months.
What caused the 2015–16 China Selloff and why did it affect global markets?
The immediate trigger was the collapse of China’s domestic equity bubble, which had inflated more than 150% between mid-2014 and mid-2015. A botched circuit-breaker intervention in January 2016 and a yuan devaluation in August 2015 intensified global fears of a Chinese hard landing. Because China had become the world’s largest trading nation and the dominant buyer of commodities, its slowdown transmitted rapidly into commodity prices, emerging market currencies, and the revenues of global multinationals — all heavily represented in MSCI World.
Should investors have bought more MSCI World during the 2015–16 selloff?
In hindsight, continuing to invest during the drawdown proved to be the optimal strategy. The DCA simulation shows that investors who kept adding $200 per month not only recovered faster but ended the 24-month period with meaningful gains above their total contributions. The key challenge was psychological: August 2015 and January 2016 both felt like the beginning of a prolonged global recession rather than temporary dislocations, making it emotionally difficult to continue investing.
How does the MSCI World 2015–16 selloff compare to other major global market crashes?
The 2015–16 China Selloff was milder than the 2008 Global Financial Crisis, during which MSCI World fell over 50%. However, its 20.2% decline was steeper and longer-lasting than many investors expected from a supposedly diversified global index, and its recovery was slower than the S&P 500’s — a pattern that repeated in 2022. It stands as a reminder that global diversification reduces single-country risk but introduces sensitivity to global trade and commodity cycles.
What does the MSCI World 2015–16 experience teach investors about China exposure in global portfolios?
The selloff revealed that MSCI World’s exposure to China is not only through direct index inclusion but indirectly through the revenues of European, Japanese, and Australian companies that depend heavily on Chinese demand. Investors in “developed market only” indices assumed they had limited China risk — that assumption proved costly. The episode led many investors to look more carefully at the indirect China revenue dependence embedded in seemingly unrelated global sector weightings.