What Happens If You Invest $1,000 a Year for 30 Years?
Investing doesn’t require large monthly contributions to work. In fact, many long-term investors start with small, consistent yearly investments. But what really happens if you invest $1,000 per year for 30 years? Is it worth it? How much patience do you need? And what are the downsides?
Let’s break it down with realistic examples, different investment options, and honest pros and cons.
The Simple Math Behind $1,000 a Year
- Annual investment: $1,000
- Investment period: 30 years
- Total money invested: $30,000
The key question is not how much you invest, but what annual return you achieve and how long you stay invested. This is where compound growth does the heavy lifting.
Example Results With Different Annual Returns
The following examples assume you invest $1,000 at the end of each year.
1. Conservative Portfolio (5% Annual Return)
Typical of a bond-heavy or very cautious portfolio.
- Total invested: $30,000
- Final value after 30 years: ≈ $70,000
What this shows: You more than double your money, but growth is slow. Inflation will reduce the real value of this result.
2. Balanced Portfolio (7% Annual Return)
Common for diversified stock and bond portfolios.
- Total invested: $30,000
- Final value after 30 years: ≈ $101,000
What this shows: This is where compounding becomes meaningful. The growth accelerates noticeably in the final decade.
3. Growth-Oriented Portfolio (10% Annual Return)
Historically achievable with stock-heavy portfolios over long periods.
- Total invested: $30,000
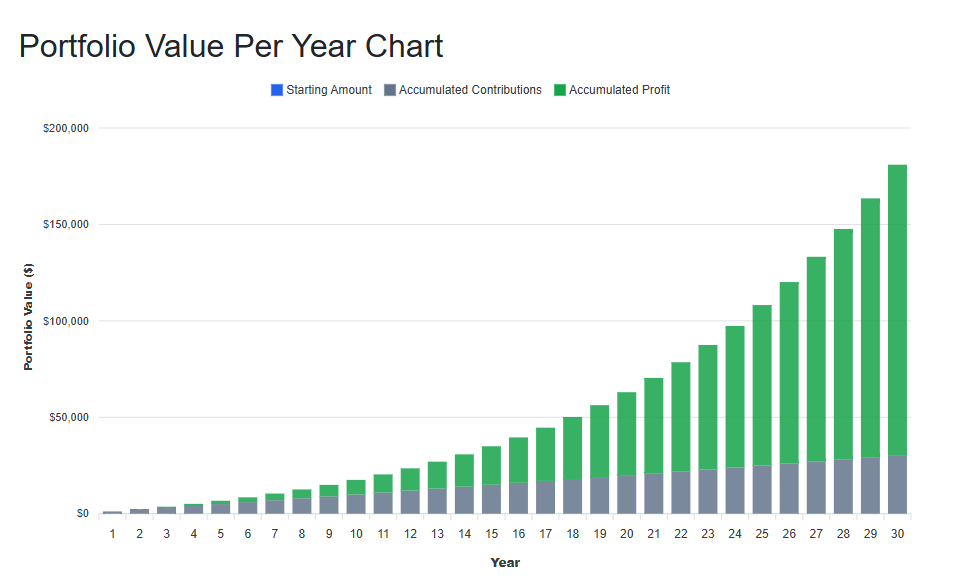
- Final value after 30 years: ≈ $180,000. That's profit around $150,000
| Year | Start Amount | Annual Investment | Profit per year | Total |
|---|---|---|---|---|
| 1 | 0.00 | 1,000.00 | 100.00 | 1,100.00 |
| 2 | 1,100.00 | 1,000.00 | 210.00 | 2,310.00 |
| 3 | 2,310.00 | 1,000.00 | 331.00 | 3,641.00 |
| 4 | 3,641.00 | 1,000.00 | 464.10 | 5,105.10 |
| 5 | 5,105.10 | 1,000.00 | 610.51 | 6,715.61 |
| 6 | 6,715.61 | 1,000.00 | 771.56 | 8,487.17 |
| 7 | 8,487.17 | 1,000.00 | 948.72 | 10,435.89 |
| 8 | 10,435.89 | 1,000.00 | 1,143.59 | 12,579.48 |
| 9 | 12,579.48 | 1,000.00 | 1,357.95 | 14,937.42 |
| 10 | 14,937.42 | 1,000.00 | 1,593.74 | 17,531.17 |
| 11 | 17,531.17 | 1,000.00 | 1,853.12 | 20,384.28 |
| 12 | 20,384.28 | 1,000.00 | 2,138.43 | 23,522.71 |
| 13 | 23,522.71 | 1,000.00 | 2,452.27 | 26,974.98 |
| 14 | 26,974.98 | 1,000.00 | 2,797.50 | 30,772.48 |
| 15 | 30,772.48 | 1,000.00 | 3,177.25 | 34,949.73 |
| 16 | 34,949.73 | 1,000.00 | 3,594.97 | 39,544.70 |
| 17 | 39,544.70 | 1,000.00 | 4,054.47 | 44,599.17 |
| 18 | 44,599.17 | 1,000.00 | 4,559.92 | 50,159.09 |
| 19 | 50,159.09 | 1,000.00 | 5,115.91 | 56,275.00 |
| 20 | 56,275.00 | 1,000.00 | 5,727.50 | 63,002.50 |
| 21 | 63,002.50 | 1,000.00 | 6,400.25 | 70,402.75 |
| 22 | 70,402.75 | 1,000.00 | 7,140.27 | 78,543.02 |
| 23 | 78,543.02 | 1,000.00 | 7,954.30 | 87,497.33 |
| 24 | 87,497.33 | 1,000.00 | 8,849.73 | 97,347.06 |
| 25 | 97,347.06 | 1,000.00 | 9,834.71 | 108,181.77 |
| 26 | 108,181.77 | 1,000.00 | 10,918.18 | 120,099.94 |
| 27 | 120,099.94 | 1,000.00 | 12,109.99 | 133,209.94 |
| 28 | 133,209.94 | 1,000.00 | 13,420.99 | 147,630.93 |
| 29 | 147,630.93 | 1,000.00 | 14,863.09 | 163,494.02 |
| 30 | 163,494.02 | 1,000.00 | 16,449.40 | 180,943.42 |
Want to test different scenarios yourself? You can explore how investing $1,000 per year over 30 years performs with a 10% annual return using this interactive calculator: Portfolio Growth Calculator .
What this shows: One-sixth of the final amount comes from your contributions — most of the money comes from growth.
Key takeaway: Time matters more than contribution size. The last 10 years generate a disproportionate share of the gains. I like to say that it brings you rewards of what you sow, even if it takes a long time and patience.
Where Could You Invest $1,000 a Year?
1. Diversified ETF Portfolio
- Mix of global stock ETFs and bonds
- Expected annual return: 6–8%
- Balanced risk and stability
Best for: Most long-term investors
2. S&P 500–Focused Investment
- Tracks large U.S. companies
- Higher volatility
- Long-term historical return: ~9–10% (nominal)
Best for: Investors who can tolerate market drawdowns
3. Conservative Assets (Bonds, Savings, Gold-heavy)
- Lower volatility
- Lower returns (3–6%)
Best for: Capital preservation, not aggressive growth. Btw. gold rose a lot during year 2025 with over 40% return.
4. High-Risk Assets (Crypto, Single Stocks)
- Very high volatility
- Unpredictable long-term outcomes
Best for: Small allocations only. My personal portfolio contains less than 7-8% of investment in Bitcoin.
Good Things About Investing $1,000 a Year
- Low pressure, high consistency: Easier to maintain than large monthly contributions. Investing is marathon, not way to become rich over night.
- Builds long-term habits: Consistency matters more than timing.
- Time works in your favor: Compounding becomes powerful over decades. There is sometimes temptation to take out money from portfolio or some specific situation when it is needed but I rather never touch anything from there. So I plan carefully.
- Easy to scale: Contributions can increase as income grows. You can always adapt contribution depending of your salary at that moment.
The Downsides You Should Know
- Slow early progress: The first 10–15 years can feel unrewarding. People who looks near in the future could be disappointed.
- Inflation risk: Low returns may barely beat inflation. You should always take in consideration that constant inflation makes your money worth less then 10, 20 or 30 years ago.
- Market volatility: Some years will be negative. This is inevitable and very possible during so long period.
- Not enough alone for retirement, at least in USA: It works best as a foundation, not the full plan.
How Much Patience Is Really Needed?
A lot. The psychological challenge is often bigger than the financial one.
- Years 1–10: Feels insignificant
- Years 11–20: Progress becomes visible
- Years 21–30: Compounding accelerates
Check how interests (green color) go exponencialy higher in last 10 years
Key Takeaways
- $1,000 a year is enough to build meaningful wealth if you stay consistent and give compounding time to work.
- Time matters more than contribution size — the last 10 years generate a disproportionate share of gains.
- Growth-oriented portfolios benefit most from long investment horizons, but require patience during market downturns.
- Early years feel slow, which is why many investors quit too soon.
- This strategy works best as a foundation, not a complete retirement plan.
If there’s one lesson to remember, it’s this: small, boring investments done consistently beat big plans that are never followed through.
Related:
- Compound Interest Calculator: See How Gold and Bitcoin Grow Over Time
- 5 Years to Retirement Portfolio
About the Author
I am a software developer focused on building financial modeling tools and investment simulations that help long-term investors understand compounding, market cycles, and portfolio behavior.
I created PortfolioCalc to explore how contribution timing, return sequences, and different asset classes impact long-term wealth outcomes. The calculators and examples on this site are based on quantitative modeling and scenario analysis.
In addition to developing these tools, I personally invest in diversified ETFs, gold, and Bitcoin using a long-term, data-driven approach. While I am not a licensed financial advisor, the content on this site is designed to translate financial mathematics into practical, educational insights.