S&P 500 Total Return vs Price Return (CAGR Difference Explained)
Short answer: The S&P 500 total return CAGR is about 9–10% per year with dividends reinvested, while the price-only CAGR is around 6–7%. The difference comes from dividends.
Calculate S&P 500 returns (total return vs price-only CAGR)
| Type | CAGR | Includes Dividends? | Real Investor Outcome |
|---|---|---|---|
| Price Return | ~6–7% | No | Underestimates long-term growth |
| Total Return | ~9–10% | Yes | Reflects real compounding |
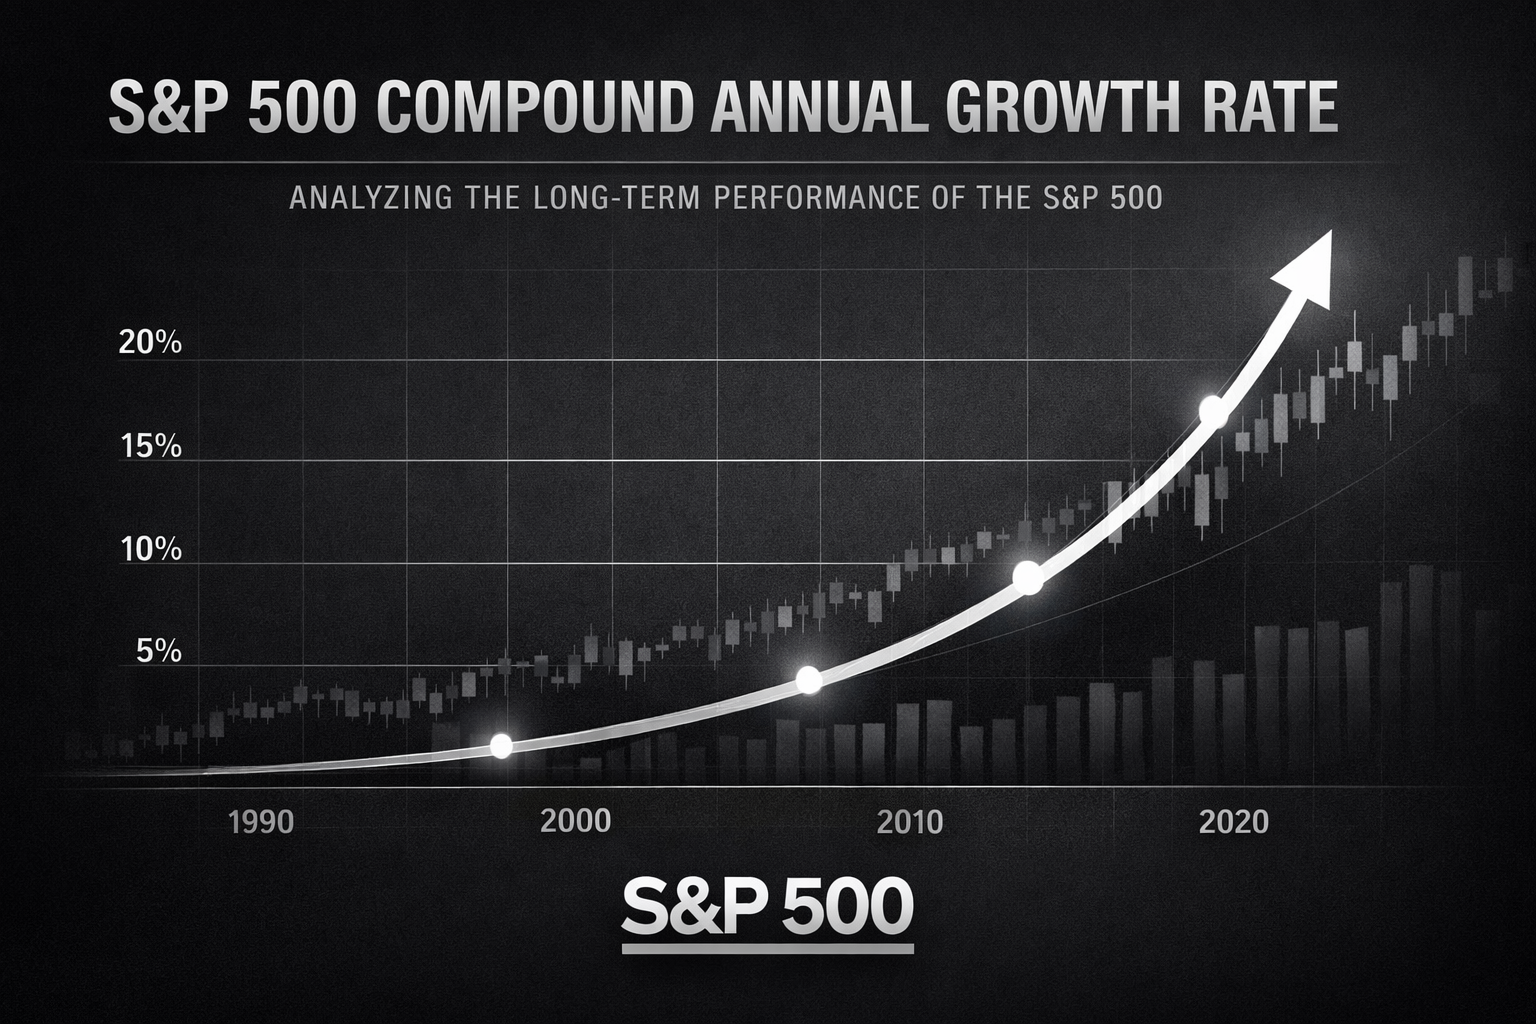
S&P 500 Total Return vs Price Return (Key Difference)
The difference between total return and price return is one of the most important concepts in long-term investing. While both metrics describe market performance, they tell very different stories about actual investor outcomes.
- Price return: Measures only index price changes and ignores dividends
- Total return: Includes dividends reinvested back into the index
Because dividends are reinvested, total return compounds faster. Over long periods, even a small percentage difference leads to dramatically different results.
Why Dividends Create Such a Big Difference
Dividends may seem small in a single year, but they play a major role over decades. When dividends are reinvested, they generate additional returns, which then generate even more returns.
This compounding effect explains why the gap between total return and price return grows significantly over time.
- Short-term (1–3 years): small difference
- Medium-term (10–15 years): noticeable difference
- Long-term (20–30+ years): massive gap
How Total Return vs Price Return CAGR Is Calculated
The CAGR formula is identical in both cases:
CAGR = (Ending Value / Beginning Value)^(1 / Years) - 1
The difference comes from the input data:
- Price-only CAGR: Based on index price levels
- Total return CAGR: Includes reinvested dividends
This is why total return CAGR is considered the more accurate representation of investor performance.
Step-by-Step Example
Let’s walk through a simplified comparison:
- Initial investment: $10,000
- Investment period: 30 years
- Scenario A (price-only CAGR 7%) → ~$76,000
- Scenario B (total return CAGR 10%) → ~$174,000
Even though the difference in CAGR is only 3%, the final result is more than 2x larger with total return.
When to Use Total Return vs Price Return
Both metrics have their place, depending on what you're analyzing:
- Use price return: when analyzing market movements or index trends
- Use total return: when estimating actual investment performance
For most investors, total return is the more relevant metric.
What Is the Average S&P 500 CAGR?
Historical averages vary depending on the time period, but typical estimates are:
- Price-only CAGR: ~6–7%
- Total return CAGR: ~9–10%
Because of market volatility, these are long-term averages—not guaranteed returns.
Common Mistakes Investors Make
- Ignoring dividends when estimating returns
- Using price return instead of total return in projections
- Assuming CAGR represents actual yearly performance
These mistakes can lead to unrealistic expectations and poor planning decisions.
Using a CAGR Calculator (Total vs Price Return)
A calculator allows you to model both scenarios and understand how reinvested dividends impact long-term growth.
Calculate S&P 500 returns using a CAGR calculator
Limitations of CAGR
- Does not reflect volatility
- Assumes smooth growth
- Does not capture sequence risk
CAGR is best used as a long-term planning tool rather than a short-term prediction method.
Final Thoughts
The difference between total return and price return is critical for understanding real investment performance.
While price return shows how the index moves, total return shows how your investment actually grows. Over decades, the difference can be life-changing.
Frequently Asked Questions (FAQ)
What is the difference between total return and price return?
Price return measures only index price changes, while total return includes dividends reinvested.
Why is total return higher than price return?
Because dividends are reinvested and compound over time.
What is the S&P 500 total return CAGR?
Historically around 9–10% per year.
What is the S&P 500 price return CAGR?
Typically around 6–7% per year.