Year-by-Year Portfolio Growth: How Your Investments Really Compound Over Time
Have you ever wondered how a portfolio grows over time? What do the years look like when you take the average historical growth of assets? Of course, it is not possible to predict the future and commit to growing your investments in the same way, but when investing for the long term, you can get an idea of the income based on historical facts.
Most investors focus on one number: the final portfolio value. While that number looks impressive after 20 or 30 years, it hides the most important part of investing — how the portfolio grows year by year.
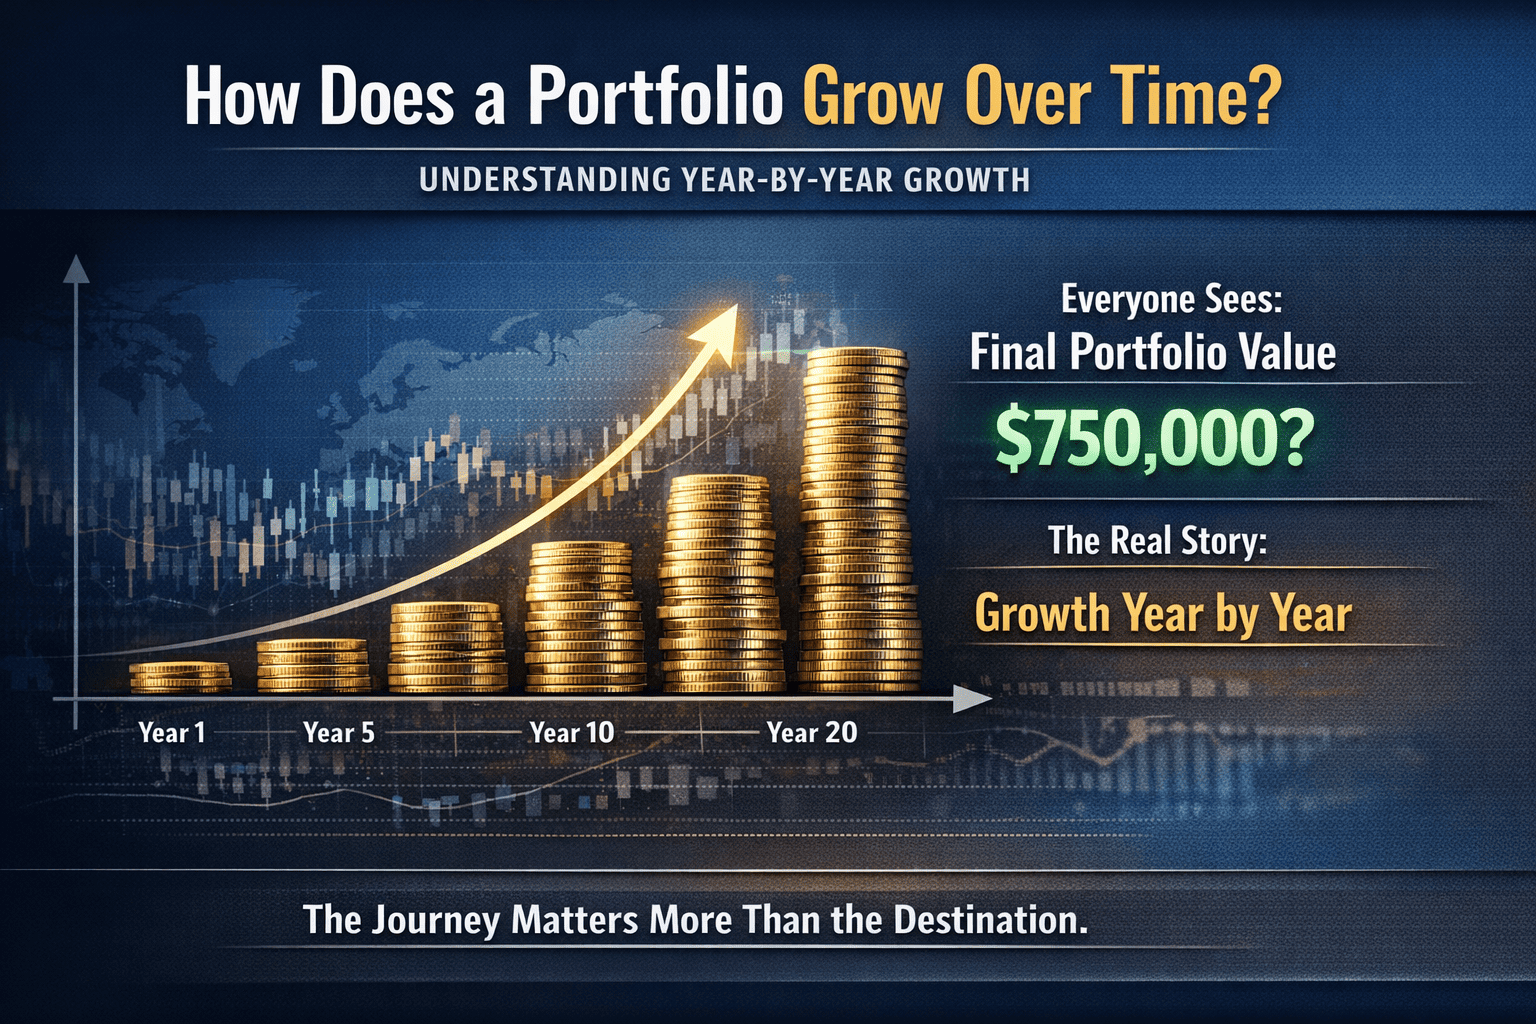
Tracking year-by-year portfolio performance reveals when contributions matter most, when compounding takes over, and which assets actually drive returns. This insight helps investors make smarter, data-driven decisions instead of guessing or reacting emotionally.
In this guide, we break down a realistic 3-asset portfolio made up of the S&P 500, MSCI World, and Gold. This is a common setup for medium-risk investors seeking long-term growth with some protection against volatility.
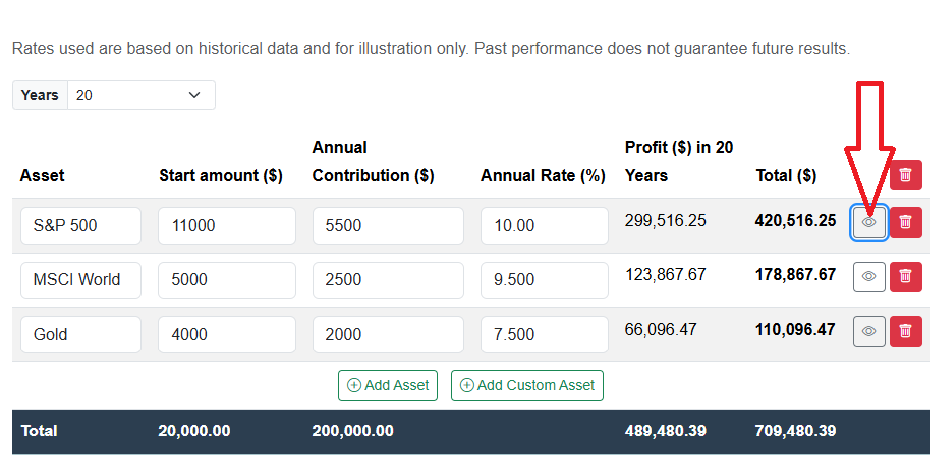
You can follow every number using our Portfolio Growth Calculator here: Calculator
This calculator is based on the historical average rate for assets and shows by clicking the 'view' button how profit and total amount of assets grow over time by year for each asset separately.
I personally use a calculator to predict the potential growth of my money over the years. It motivates me to continue investing and not make hasty decisions. This way I have an insight into how important patience is over time because what happens in the later stages of investing shows that patience and persistence pay off in the end.
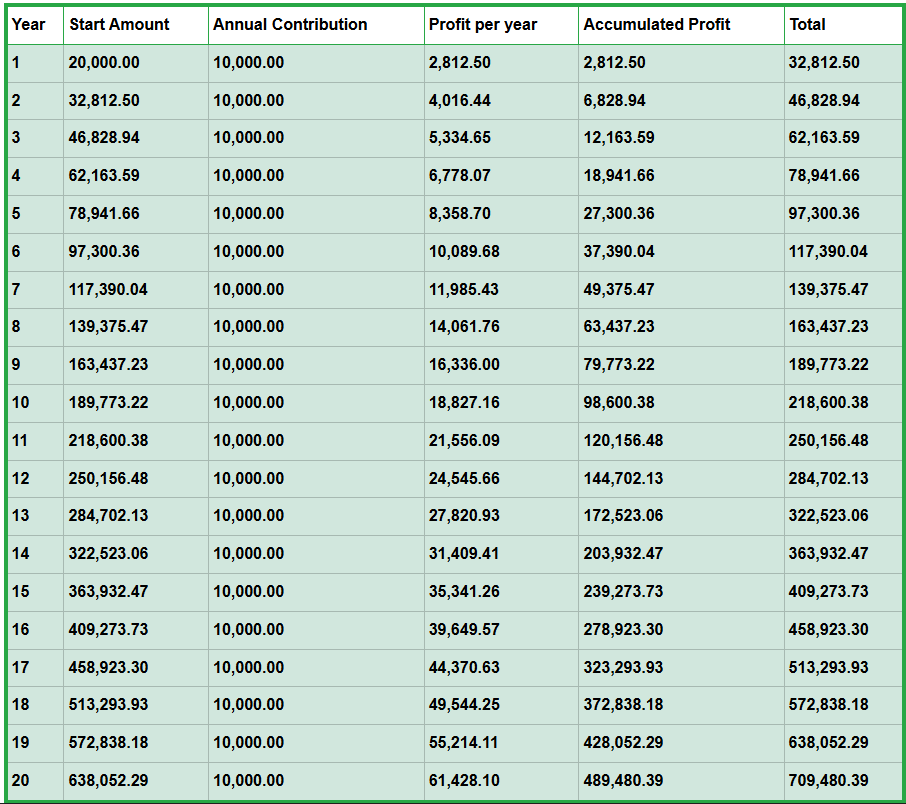
Below the table with assets, a chart and table are displayed where the total value for all assets together is visible and again organized by year.
Rather than theory, we’ll focus on practical numbers to show exactly how money compounds, year after year.
Typical Three-Asset Portfolio Setup
This portfolio reflects a balanced, growth-oriented strategy:
| Asset | Typical Allocation | Why It’s Included |
|---|---|---|
| S&P 500 | 55% | Main long-term growth engine |
| MSCI World | 25% | International diversification |
| Gold | 20% | Stability during market stress |
We will take in consideration that contribution is added at the beginning of each year.
With a $20,000 starting portfolio and consistent yearly contributions, this becomes:
| Asset | Starting Amount | Annual Contribution | Expected Return |
|---|---|---|---|
| S&P 500 | $11,000 | $5,500 | 10% |
| MSCI World | $5,000 | $2,500 | 9.5% |
| Gold | $4,000 | $2,000 | 7.5% |
This structure aims to grow aggressively in good markets while staying resilient during downturns.
Before we analyze growth per year or period, check table with total assets growth:
Year 1 Portfolio Growth: Establishing the Foundation
The first year is where habits are formed. Since contributions are added at the beginning of the year, they benefit from a full year of compounding.
Gold
- Starting: $4,000
- Contribution: +$2,000 → $6,000
- Return: $6,000 × 7.5% = $450
- End of Year 1: $6,450.00
S&P 500
- Starting: $11,000
- Contribution: +$5,500 → $16,500
- Return: $16,500 × 10% = $1,650
- End of Year 1: $18,150.00
MSCI World
- Starting: $5,000
- Contribution: +$2,500 → $7,500
- Return: $7,500 × 9.5% = $712.50
- End of Year 1: $8,212.50
Portfolio total: $6,450.00 + $18,150.00 + $8,212.50 = $32,812.50
What this shows: Adding contributions at the start of the year immediately boosts compounding, even in Year 1.
Year 2 Portfolio Growth: Compounding Accelerates
In Year 2, both last year’s gains and new contributions compound together.
Gold
- Starting: $6,450.00
- Contribution: +$2,000 → $8,450.00
- Return: $8,450 × 7.5% = $633.75
- End of Year 2: $9,083.75
S&P 500
- Starting: $18,150.00
- Contribution: +$5,500 → $23,650.00
- Return: $23,650 × 10% = $2,365.00
- End of Year 2: $26,015.00
MSCI World
- Starting: $8,212.50
- Contribution: +$2,500 → $10,712.50
- Return: $10,712.50 × 9.5% = $1,017.69
- End of Year 2: $11,730.19
Portfolio total: $46,828.94
Insight: Early contributions now generate noticeable gains, especially in higher-return assets.
Years 3–5 Portfolio Growth: Momentum Builds
By Years 3 to 5, the portfolio begins to show visible momentum. At this stage, the impact of compounding becomes easier to feel, even though contributions are still a major driver of growth. Each new yearly investment doesn’t just add fresh capital — it stacks on top of balances that have already grown from prior returns.
The higher-return assets, especially the S&P 500 and MSCI World, start pulling more weight, while Gold continues to smooth volatility. Small percentage gains now translate into larger dollar increases, reinforcing the value of consistency.
- Portfolio total (approx.):
- Year 3: $62,163
- Year 4: $78,941
- Year 5: $97,300
Key takeaway: Momentum builds quietly here — staying invested matters more than chasing higher returns.
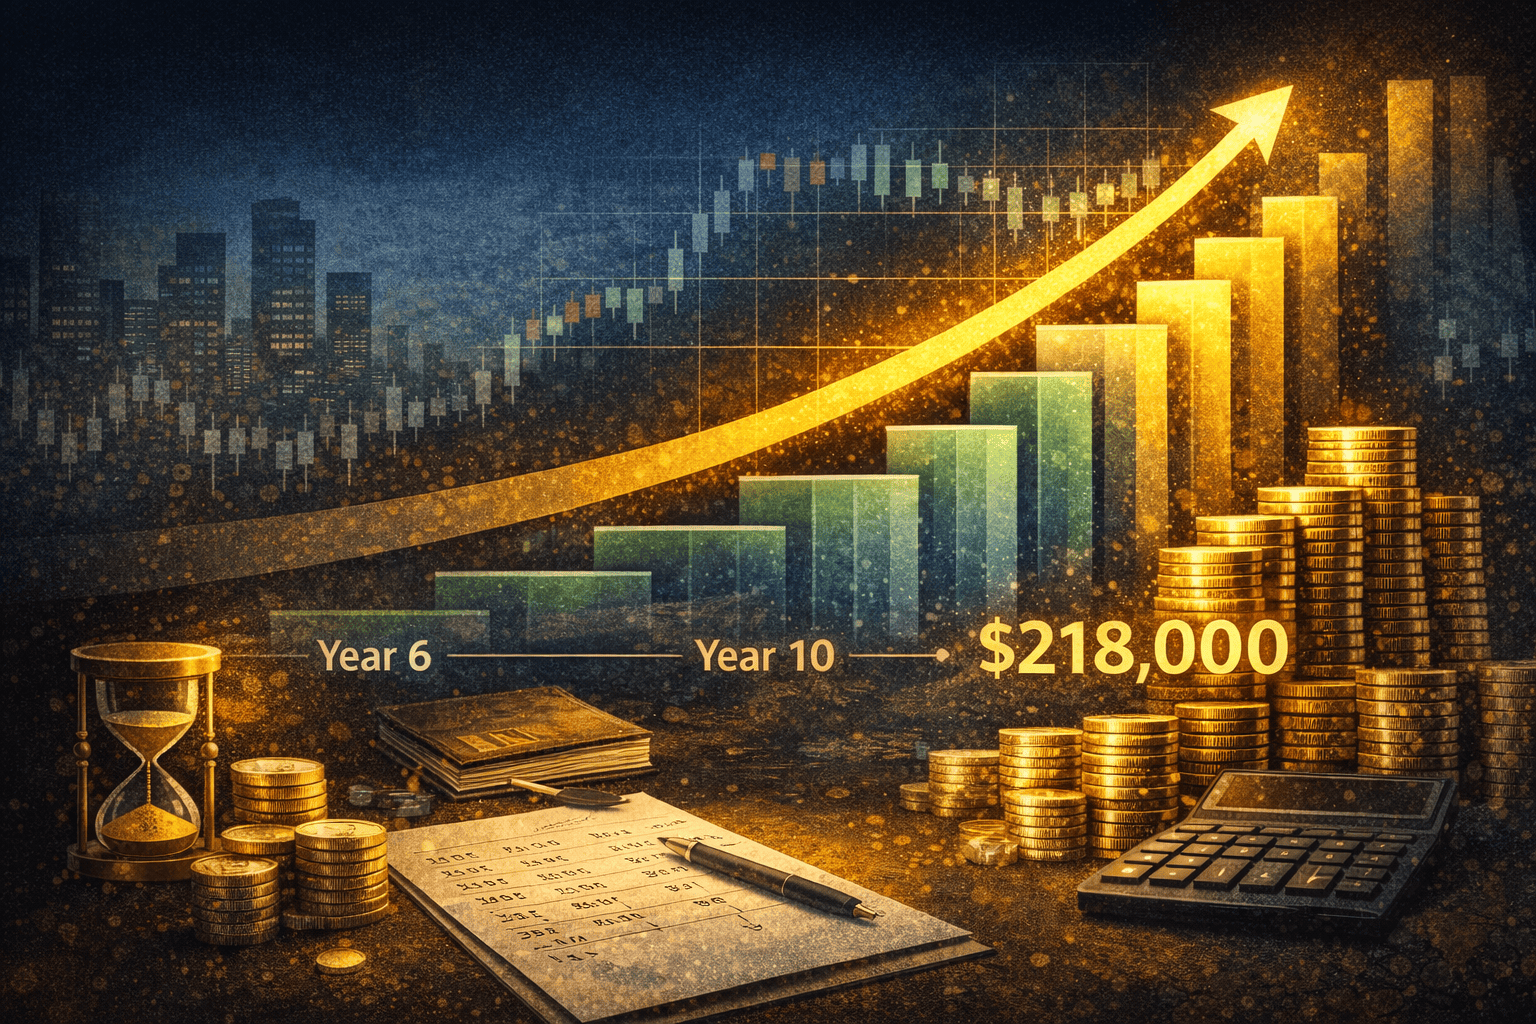
Years 6–10 Portfolio Growth: Returns Overtake Contributions
Between Years 6 and 10, the portfolio enters a critical transition phase. While annual contributions remain important, investment returns now account for a growing share of the total increase in value. The capital built in the early years finally has enough mass for compounding to work at full strength.
Market gains during this period often exceed what you add each year, especially in equity-heavy assets like the S&P 500 and MSCI World. Temporary market swings matter less because returns are generated from a much larger base.
By Year 10, the portfolio surpasses $218,000, clearly showing that long-term growth is increasingly driven by returns rather than savings.
Years 11–15 Portfolio Growth: When Compounding Becomes Self-Sustaining
Between Years 11 and 15, the portfolio enters a powerful phase where compounding begins to sustain growth on its own. At this point, annual returns often rival or exceed yearly contributions, even though the contribution amounts remain unchanged.
The investments made during the early years now have enough time behind them to generate meaningful returns. Market fluctuations still occur, but their impact is softened by the growing size of the portfolio and diversified asset allocation.
During this period, the portfolio typically grows from roughly $250,000 to over $400,000. Much of this increase comes not from new money added, but from gains on existing capital.
This stage highlights why consistency beats timing. Investors who stayed disciplined through slower early years are now rewarded with accelerated growth driven largely by compounding rather than savings.
Key insight: By this point, patience starts paying visible dividends — the portfolio works harder than the investor does.
Years 16–20 Portfolio Growth: Compounding Takes Control
With contributions added at the beginning of each year, the portfolio reaches approximately $709,000+ by Year 20.
- Most growth now comes from returns, not new contributions
- Earlier contributions have multiplied several times over
- Small return differences create six-figure impacts
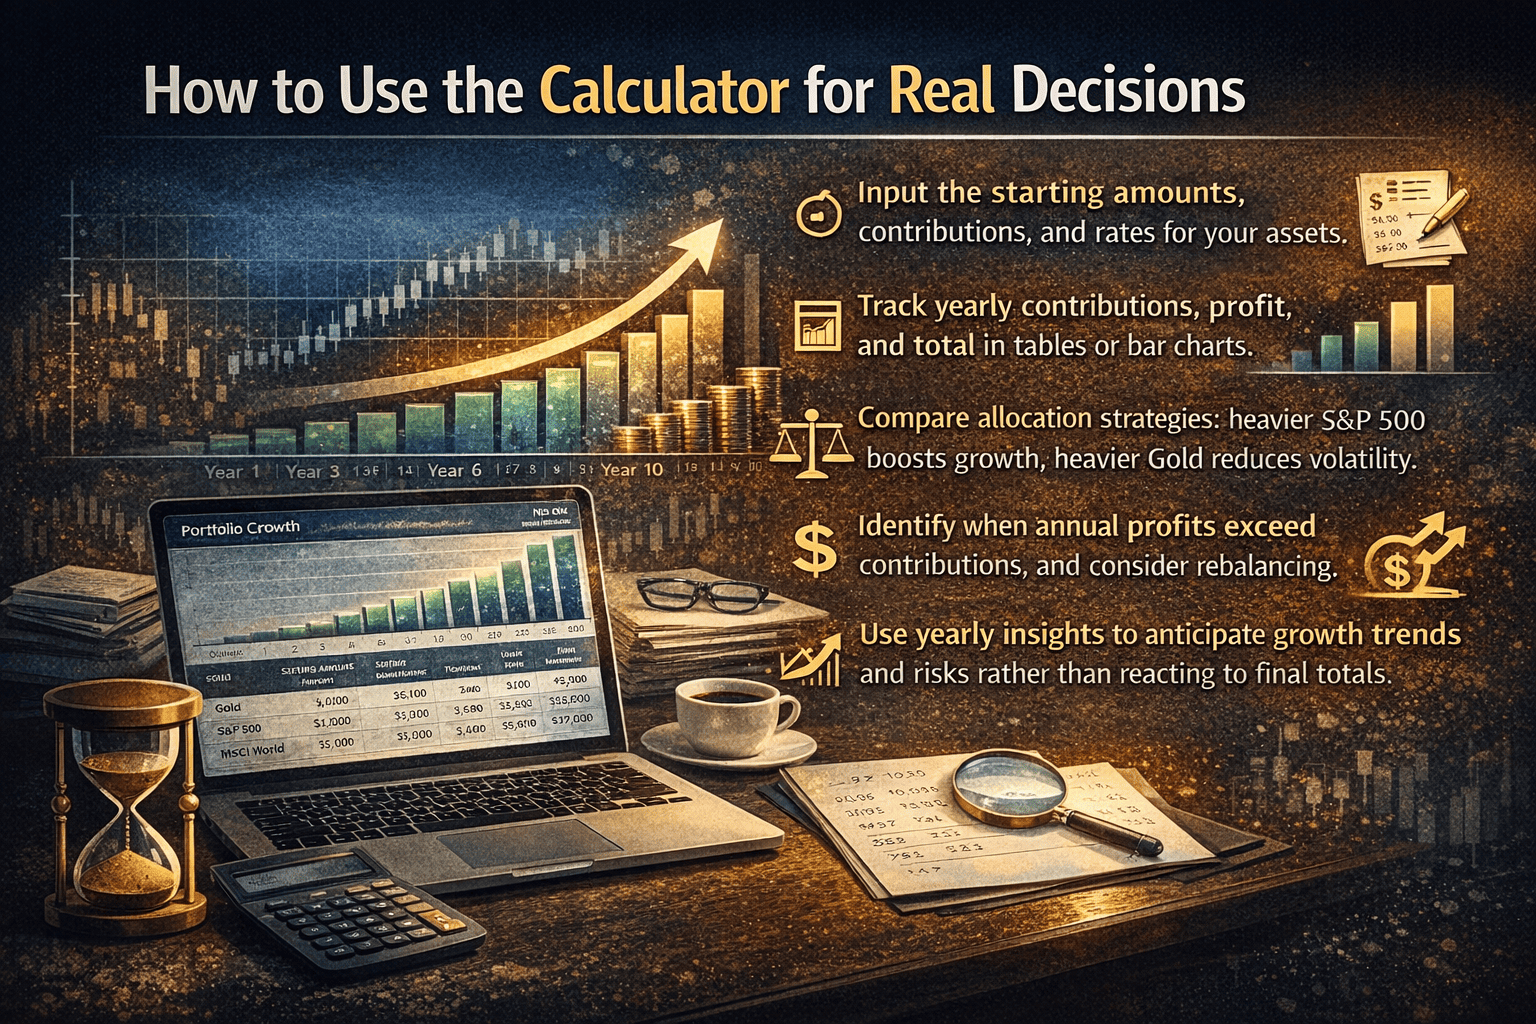
How to Use the Calculator for Real Decisions
- Input the starting amounts, contributions, and rates for your assets.
- Track yearly contributions, profit, and total in tables or bar charts.
- Compare allocation strategies: heavier S&P 500 boosts growth, heavier Gold reduces volatility.
- Identify when annual profits exceed contributions, and consider rebalancing.
- Use yearly insights to anticipate growth trends and risks rather than reacting to final totals.
Key Takeaways from Year-by-Year Analysis
- Early Years: Contributions drive most growth, compounding starts immediately.
- Mid Years: Compounding exceeds contributions, especially for S&P 500.
- Later Years: Annual profits dominate, making asset allocation and early contributions the most impactful factors.
- Diversification: Gold stabilizes returns, S&P 500 drives growth, MSCI World reduces single-market risk.
- Yearly Tracking: Provides actionable insights for rebalancing, contribution planning, and evaluating underperforming assets.
Why Year-by-Year Tracking Matters
Looking only at the final number hides critical insights:
- When compounding accelerates
- Which asset truly drives growth
- When risk exposure increases naturally
Year-by-year analysis helps investors adjust contributions, allocations, and expectations with confidence.
In my opinion, this kind of monitoring is important in order to align with long-term expectations. When you realize that in the first years there is not as much growth as in later years, it is easier to stay focused and continue investing. This is something that some investors do not understand.
Monitoring also allows you to adjust your goals, increase your annual contribution or decrease it according to your plans. It also provides insight into how to rebalance your investments, i.e. transfer money from one asset to another at a later time in order to remain consistent with your long-term plan.
Try It Yourself
Explore this exact portfolio and adjust assumptions in real time:
The earlier you understand how growth unfolds year by year, the easier long-term investing becomes.
Disclaimer
This article and the portfolio growth calculator are provided for educational and informational purposes only. They do not constitute financial, investment, tax, or legal advice.
All examples, calculations, and projections are based on historical average returns and simplified assumptions. Actual market performance, asset returns, inflation, fees, taxes, and individual circumstances may vary significantly. Past performance is not indicative of future results.
Before making any investment decisions, consider your financial situation, risk tolerance, and investment objectives, and consult with a qualified financial advisor if needed.