How to Recover From a 50% Stock Market Loss (Recovery Time Explained)
A 50% Market Crash Requires a 100% Gain.
Why a 50% Loss Is More Severe Than It Looks
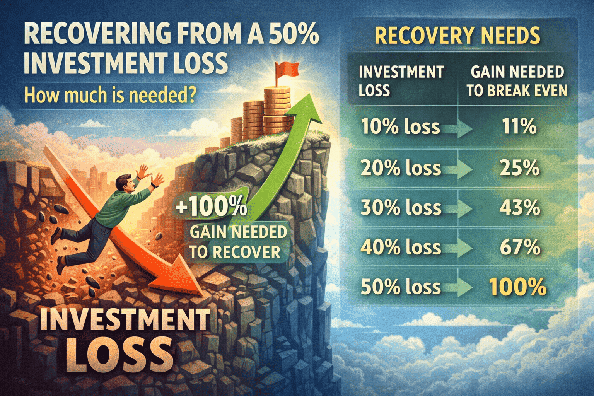
When your investments drop by 50%, you need a 100% gain just to return to your original value. This is one of the most misunderstood concepts in investing and explains why large drawdowns are so dangerous.
I personally experienced a 25% decline in assets, and I can say it was far from a pleasant experience. I can only imagine how difficult it must be to endure a 50% loss on hard-earned money that was saved over many years. In this article, I will focus on a 50% drop, although everything discussed here can be applied to most major market declines.
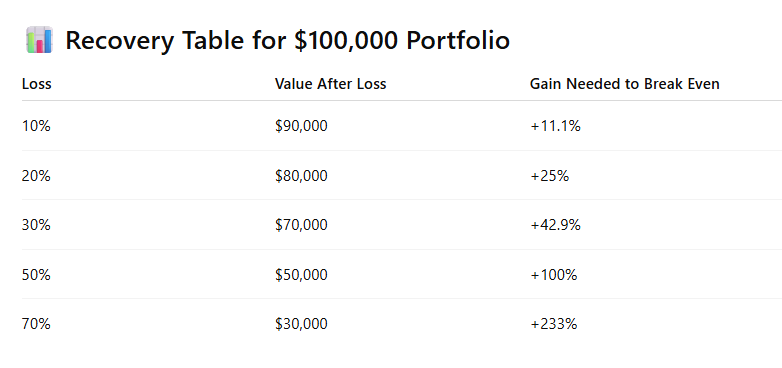
Let’s look at this example:
Start with: $100,000
Market drops 50%
Portfolio becomes:
👉 $50,000
To get back to $100,000 from $50,000:
You now need a +100% return
Take a look at the table showing other loss percentages. As the percentage loss increases, the required percentage gain needed to return to the original value grows exponentially.
The Time Required to Recover From a 50% Drop
In this section, we will examine how many years it may take for your portfolio to recover from a 50% decline using different annual return assumptions:
- 6% annually
- 8% annually
- 10% annually
6% Annual Rate:
| Year | Start | Acc. Profit | Total |
|---|---|---|---|
| 1 | 50,000 | 3,000 | 53,000 |
| 2 | 53,000 | 6,180 | 56,180 |
| 3 | 56,180 | 9,550.80 | 59,550.80 |
| 4 | 59,550.80 | 13,123.85 | 63,123.85 |
| 5 | 63,123.85 | 16,911.28 | 66,911.28 |
| 6 | 66,911.28 | 20,925.96 | 70,925.96 |
| 7 | 70,925.96 | 25,181.51 | 75,181.51 |
| 8 | 75,181.51 | 29,692.40 | 79,692.40 |
| 9 | 79,692.40 | 34,473.95 | 84,473.95 |
| 10 | 84,473.95 | 39,542.38 | 89,542.38 |
| 11 | 89,542.38 | 44,914.93 | 94,914.93 |
| 12 | 94,914.93 | 50,609.82 | 100,609.82 |
You can experiment with this calculator by testing different amounts, rates, and time horizons to see how recovery time changes.
As can be seen from the picture, it takes up to 12 years for the investor to return to the initial state. The recovery is weaker due to lower growth of 6%. However, these statistics should be taken with a grain of salt because rarely is growth continuous and the same for 12 years. That's long period to recover.
8% Annual Rate:
| Year | Start | Acc. Profit | Total |
|---|---|---|---|
| 1 | 50,000 | 4,000 | 54,000 |
| 2 | 54,000 | 8,320 | 58,320 |
| 3 | 58,320 | 12,985.60 | 62,985.60 |
| 4 | 62,985.60 | 18,024.45 | 68,024.45 |
| 5 | 68,024.45 | 23,466.40 | 73,466.40 |
| 6 | 73,466.40 | 29,343.72 | 79,343.72 |
| 7 | 79,343.72 | 35,691.21 | 85,691.21 |
| 8 | 85,691.21 | 42,546.51 | 92,546.51 |
| 9 | 92,546.51 | 49,950.23 | 99,950.23 |
In this case, recovery is noticeablely faster than in the previous case. After approximatelly 9 years investitor will get to the total sum around 100.000 dollars. However, this is still not a short period.
10% Annual Rate:
| Year | Start | Acc. Profit | Total |
|---|---|---|---|
| 1 | 50,000 | 5,000 | 55,000 |
| 2 | 55,000 | 10,500 | 60,500 |
| 3 | 60,500 | 16,550 | 66,550 |
| 4 | 66,550 | 23,205 | 73,205 |
| 5 | 73,205 | 30,525.50 | 80,525.50 |
| 6 | 80,525.50 | 38,578.05 | 88,578.05 |
| 7 | 88,578.05 | 47,435.85 | 97,435.85 |
This is the fastest recovery of the 3 listed and is about 7 years for the investor to be at the starting point of $100,000. It should be kept in mind that periods after major declines are often affected by higher than average growth. Sudden falls often lead to unrealistically low share prices on the stock market.
When the fear disappears, investors start pouring in their money again. When a small growth occurs, confidence rises and capital is returned, ie. the demand for shares and therefore the shares grow faster than the average growth.
However, it should be kept in mind that not all recoveries are the same, ie. not every time there was a sharp rise after a big fall. 2000 dot-com crisis took longer to recover.
To summarize, the recovery period looks like this:
| Annual Return | Years to Recover | Value at Recovery |
|---|---|---|
| 6% | ~12 years | $100,609 |
| 8% | ~9 years | $99,960 |
| 10% | ~7 years | $97,435 |
This table assumes average annual growth rates of 6%, 8%, and 10%, which represent typical long-term average returns of certain assets, such as an S&P 500 ETF (historically around 10%). However, in practice, recovery may be shorter or longer depending on market conditions.
S&P 500 Drops and Recovery Time During Major Crashes
Historical Market Example
Let’s look at some of the largest historical declines of the S&P 500 and how long it took investors to recover:
- Dot-com crash (~50%)
- 2008 financial crisis (~50%)
- 1929 crash (~80% peak to trough)
1️⃣ Dot-Com Crash (2000–2002)
- Peak: March 2000
- Bottom: October 2002
- Drop: ~49%
- Peak Value: ~1,527
- Bottom Value: ~777
- Recovery Time: ~7 years
- Recovered: May 2007
2️⃣ Global Financial Crisis (2007–2009)
- Peak: October 2007
- Bottom: March 2009
- Drop: ~57%
- Peak Value: ~1,565
- Bottom Value: ~666
- Recovery Time: ~5.5 years
- Recovered: March 2013
3️⃣ Great Depression (1929–1932)
- Peak: September 1929
- Bottom: June 1932
- Drop: ~86%
- Recovery Time (Nominal): ~25 years
- Recovered: 1954
📊 Quick Comparison Table
| Crisis | S&P 500 Drop | Recovery Time |
|---|---|---|
| Dot-Com (2000) | ~49% | ~7 years |
| Financial Crisis (2008) | ~57% | ~5.5 years |
| Great Depression (1929) | ~86% | ~25 years |
🔎 Key Insight
A ~50% drop has happened multiple times in history and typically required 5–7 years to recover. However, extreme drawdowns above 80% are rare and can take decades to recover. Throughout this article, we are discussing nominal recovery. Real recovery (adjusted for inflation) takes even longer, but for simplicity, inflation is not included here.
The Emotional Multiplier of a 50% Loss
Now we come to the psychological side of losing 50% of your portfolio value. It is an extremely stressful and difficult period for an investor. It can feel like the system is broken, and many investors take it personally.
What very often happens is that investors sell their assets, turning a temporary loss into a permanent one.
There are also investors who do not sell but decide to stop investing for a period of time until they see signs of recovery or safety before returning to the market. Ironically, this is usually the period when expected returns are the highest.
A third type of investor shifts into safer assets such as bonds or cash.
Why a 50% Loss Feels Worse Than It Is
Two reasons:
1️⃣ Loss Aversion
Psychologically, losses hurt about 2× more than equivalent gains feel good. A 50% drop feels catastrophic. A 50% gain feels “nice.”
2️⃣ Recency Bias
During crashes, it feels like:
“This time is different.”
“It will never recover.”
“The system is broken.”
Every major crash in history felt like the end at the time.
What If You Continue Investing After a 50% Crash?
The previous examples assumed no additional contributions after the market decline. But in reality, most disciplined long-term investors continue investing every month regardless of market conditions. This difference completely changes the recovery dynamic.
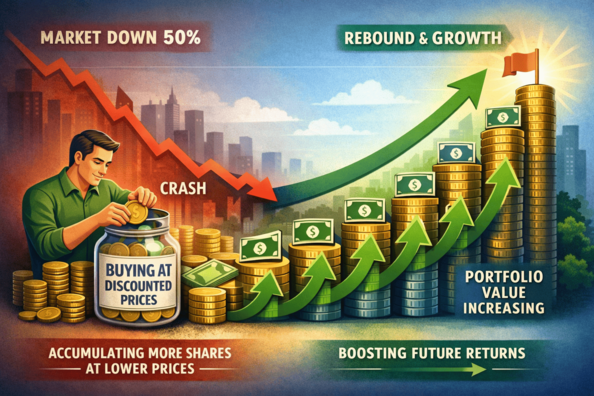
When markets drop 50%, prices are significantly lower. Every new contribution during that period buys more shares or units than before the crash. Instead of simply waiting for your original portfolio to recover, you are actively accumulating assets at discounted valuations. Over time, this increases your total position and amplifies the effect of the eventual rebound.
Historically, investors who maintained consistent contributions during major downturns often recovered faster than those who paused investing out of fear. Continuing to invest turns volatility into an advantage rather than a setback.
Try adjusting the calculator by adding a monthly contribution and compare how dramatically recovery time improves when consistency replaces hesitation.
Does Age Matter During a 50% Crash?
Young Investor (20s–30s):
For younger investors, a 50% crash can actually become a long-term advantage. With decades ahead before retirement, time becomes the greatest asset. Continued monthly contributions during depressed prices allow accumulation of more shares at lower valuations. When recovery eventually happens, compounding works on a larger base of accumulated assets. Volatility at this stage is uncomfortable but rarely catastrophic, provided investing continues consistently.
Mid-Career (40s–50s):
At this stage, recovery time becomes far more important. There are fewer decades left for compounding to fully repair large drawdowns. Asset allocation plays a critical role, and excessive risk can significantly delay retirement plans. Strategic rebalancing and maintaining disciplined contributions are essential.
Near Retirement:
Here, sequence-of-returns risk becomes dangerous. A 50% decline shortly before withdrawals begin can permanently impair portfolio longevity. Even if markets recover later, early withdrawals during downturns reduce the capital base, making full recovery much harder.
Final Thought
A 50% loss feels devastating. Mathematically, it is severe. Psychologically, it is overwhelming.
But history shows that markets recover. The real question is not whether markets recover — it is whether the investor stays invested long enough.
Time in the market, discipline, and continued contributions turn temporary losses into long-term gains.
Frequently Asked Questions
How long does it take to recover from a 50% stock market crash?
Recovery time depends on the average annual return after the decline. At 6% annual growth, recovery may take around 12 years. At 8%, approximately 9 years. At 10%, recovery could occur in about 7 years. Actual recovery time varies based on market conditions and consistency of returns.
Is it possible to recover from a 50% portfolio loss?
Yes, recovery is possible, but it requires a 100% gain from the bottom to return to the original value. Historically, major market declines around 50% have eventually recovered, although the timeline can vary from several years to over a decade.
What return is needed after a 50% drop?
After a 50% loss, a portfolio must gain 100% to return to its previous value. For example, if $100,000 falls to $50,000, it must double to reach $100,000 again.
Should I keep investing after a 50% crash?
Many long-term investors continue investing during major downturns. Lower prices allow new contributions to buy more shares, which can accelerate recovery when markets rebound. Historically, consistent investing during downturns has often improved long-term results.
Related:
- Psychology of Investing During Negative Returns | Investor Behavior
- Aggressive vs Conservative Portfolios: Risk, Returns, ETF Examples & Real Market Drops
- What If You Invested 10,000 in the S&P 500 Before the 2008 Crash? (Recovery Timeline)
- NASDAQ 2008 Crash: What $10,000 Became (+ Recovery Time & Returns)
- $10,000 in Dow Jones Before 2008 Crash: What Happened Next?