$10,000 S&P 500 Investment: Dot-Com Crash and Recovery (2000 Simulation)
How Long Did It Take the S&P 500 to Recover from the Dot-Com Crash?
The S&P 500 required approximately 6 years to fully recover from the Dot-Com Crash for investors who bought near the March 2000 market peak. This simulation includes reinvested dividends, which helped reduce losses and accelerate recovery compared to looking at price returns alone.
A $10,000 investment made at the peak of the technology bubble would have fallen to approximately $5,350 at the market bottom in October 2002 before eventually recovering as the S&P 500 entered a new bull market.
You can also use the simulation tool below with your own starting amount, contribution schedule, return assumptions, and investment horizon: View the full simulation of the Dot-Com Crash recovery. The table is interactive, allowing you to change the starting investment, contribution amount, and return assumptions.
For long-term investing scenarios, you can use the multi-asset calculator with the historical average annual return of approximately 10% including reinvested dividends: Open Multi-Asset Calculator
What Happened If You Invested $10,000 Before the Dot-Com Crash? (S&P 500 Scenario)
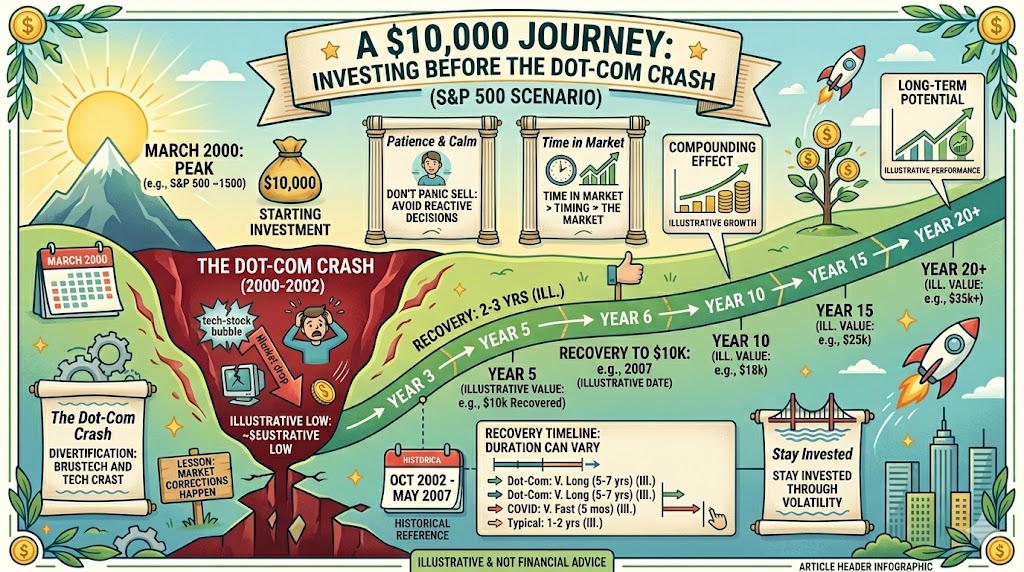
What would happen if you invested $10,000 in the S&P 500 at the peak of the Dot-Com Bubble in March 2000? Unlike the COVID crash of 2020, this was not a rapid decline followed by a quick recovery. Instead, investors faced a prolonged bear market that lasted more than two and a half years and required approximately six years to fully recover.
Many investors ask: how long did it take the S&P 500 to recover after the Dot-Com Crash? Based on returns that include reinvested dividends, investors who bought near the March 2000 peak waited more than six years before returning to break-even.
During the Dot-Com Bust, the S&P 500 lost nearly 46.5% from peak to bottom. A $10,000 investment would have fallen to approximately $5,350 at the October 2002 low, even after accounting for reinvested dividends.
What makes this market decline particularly interesting is that it unfolded slowly. Instead of a single dramatic collapse, investors experienced multiple rallies, false recoveries, and years of uncertainty before the market eventually stabilized and began a sustained recovery.
This simulation illustrates exactly what investors experienced during one of the longest and most challenging bear markets in modern stock market history.
S&P 500 Recovery Timeline: Key Milestones During and After the Dot-Com Crash
The table below highlights the most important stages of a $10,000 lump-sum investment in the S&P 500 following the market peak in March 2000. Rather than showing every month, it focuses on major turning points throughout the Dot-Com Crash and subsequent recovery.
This simulation assumes no additional contributions and includes reinvested dividends, providing a realistic view of how a long-term investor's portfolio evolved during one of the longest bear markets in modern history.
How to Read the Table
- Month: A significant milestone during the decline or recovery period.
- Accumulated Profit: Total gain or loss relative to the original $10,000 investment.
- Total: Portfolio value at that point in time.
Unlike the COVID crash, which recovered within months, the Dot-Com Crash unfolded over several years. Investors experienced multiple temporary rallies and periods of optimism before the market ultimately reached its lowest point in mid-2002.
At the bottom, the original $10,000 investment had fallen to approximately $5,339, representing a loss of about 46.6% even after accounting for reinvested dividends.
The recovery was equally challenging. It took until May 2006 for the portfolio to return to break-even on a total-return basis, demonstrating how long severe bear markets can delay investment growth despite the benefits of dividend reinvestment and compounding.
| Month | Accumulated Profit | Total |
|---|---|---|
| Mar 2000 (Peak) | -350.00 | 9,650.00 |
| Aug 2000 | -1,149.27 | 8,850.73 |
| Feb 2001 | -2,303.03 | 7,696.97 |
| Aug 2001 (Post-9/11 Selloff) | -3,511.96 | 6,488.04 |
| Oct 2001 (Relief Rally) | -3,016.70 | 6,983.30 |
| Jun 2002 | -4,563.54 | 5,436.46 |
| Jul 2002 (Bottom) | -4,661.40 | 5,338.60 |
| Jan 2003 (Recovery Begins) | -4,195.79 | 5,804.21 |
| Jan 2005 (More Than Half Recovered) | -1,914.00 | 8,086.00 |
| May 2006 (Break-Even) | -0.14 | 9,999.86 |
Want to see the complete month-by-month breakdown?
View full 75-month simulation →
Dollar-Cost Averaging During the Dot-Com Crash (S&P 500)
The table below illustrates how a disciplined monthly investment strategy performed during the 2000–2002 market downturn. Starting with an initial investment of $10,000 and continuing to make regular monthly contributions, the portfolio experienced the same market conditions as the lump-sum example but achieved a significantly different outcome.
Rather than focusing solely on portfolio value, this table also tracks the growth of total contributions alongside investment gains and losses. It demonstrates how consistent investing during periods of falling prices can help reduce the impact of market declines, accelerate recovery, and potentially improve long-term returns. The comparison with the lump-sum strategy highlights one of the key advantages of dollar-cost averaging: buying more shares when prices are low and fewer when prices are high.
Pay particular attention to the market bottom in July 2002, the recovery phase beginning in 2003, and the point at which the portfolio returns to profitability. These milestones show how regular contributions transformed a severe bear market into an opportunity to build wealth over time.
| Month | Total Contributions | Accumulated Profit | Total Portfolio |
|---|---|---|---|
| Mar 2000 (Peak) | 10,000.00 | -357.00 | 9,843.00 |
| Aug 2000 | 11,000.00 | -1,228.27 | 9,971.73 |
| Feb 2001 | 12,200.00 | -2,625.64 | 9,774.36 |
| Aug 2001 (Post-9/11 Selloff) | 13,400.00 | -4,318.12 | 9,281.88 |
| Oct 2001 (Relief Rally) | 13,800.00 | -3,588.53 | 10,411.47 |
| Jun 2002 | 15,400.00 | -6,154.20 | 9,445.80 |
| Jul 2002 (Bottom) | 15,600.00 | -6,327.83 | 9,472.17 |
| Jan 2003 (Recovery Begins) | 16,800.00 | -5,427.53 | 11,572.47 |
| Jan 2005 (Break-Even) | 21,600.00 | 16.82 | 21,816.82 |
| May 2006 | 25,000.00 | 5,569.26 | 30,569.26 |
Want to see the complete month-by-month breakdown?
View full 75-month simulation →
Frequently Asked Questions
How long did it take the S&P 500 to recover from the Dot-Com Crash?
Based on this simulation using total returns and reinvested dividends, the S&P 500 took approximately seven years to recover after the March 2000 market peak. Investors who remained invested eventually returned to break-even around 2007.
How much did a $10,000 investment lose during the Dot-Com Crash?
A $10,000 investment in the S&P 500 made near the March 2000 peak would have fallen to approximately $5,350 at the October 2002 bottom, representing a decline of roughly 46.5%.
What caused the Dot-Com Crash?
The Dot-Com Crash was triggered by the collapse of the technology stock bubble. Many internet companies had extremely high valuations despite limited profits, and investor enthusiasm eventually gave way to a sharp market correction.
Was the Dot-Com Crash worse than the COVID-19 crash?
The Dot-Com Crash lasted much longer than the COVID-19 crash. While the COVID decline was sharper in the short term, the S&P 500 recovered within months. The Dot-Com Crash required roughly seven years for investors to recover their losses.
Did reinvested dividends help during the Dot-Com recovery?
Yes. Reinvested dividends provided additional shares during the downturn and helped accelerate recovery compared with a price-only investment approach.
Would dollar-cost averaging have helped during the Dot-Com Crash?
Continuing to invest during the bear market would have lowered the average purchase price and allowed investors to accumulate more shares at depressed valuations, improving long-term results once the market recovered.