What If You Invested $10,000 in the S&P 500 Before Black Monday 1987?
How Black Monday Turned $10,000 in the S&P 500 into $6,650 — and What Happened Next
On October 19, 1987, the S&P 500 fell 20.5% in a single trading session — the largest single-day percentage drop in the index’s history. For an investor who had placed $10,000 into the market at the August 1987 peak, the months that followed were a white-knuckle test of conviction. By December 1987, that portfolio had declined to roughly $6,650, a loss of 33.5% from peak to trough. On paper, more than $3,300 had simply vanished in a matter of weeks.
Yet the story of Black Monday is one of the most instructive in market history — not because the crash was small, but because the recovery was so surprisingly swift. Unlike the Dot-Com bust or the 2008 financial crisis, the 1987 collapse was not rooted in a failing economy. Banks were solvent, unemployment was near multi-decade lows, and corporate America was generating strong earnings. The crash was a creature of market structure: computerized portfolio insurance strategies created a self-reinforcing spiral of automated sell orders that transformed a routine pullback into a historic rout. Once the mechanical selling exhausted itself, the underlying fundamentals reasserted control.
For the lump-sum investor who stayed put, break-even arrived by approximately July 1989 — roughly 23 months after the August peak. For the investor who added $200 every month during the carnage, break-even came even earlier, around November 1988. Both timelines stand in sharp contrast to the seven-year odyssey faced by Dot-Com investors or the four-and-a-half years endured after the 2008 collapse.
Run the full simulation yourself: Open the interactive simulation
For the long-run average return, use the multi-asset calculator: Open Multi-Asset Calculator
The S&P 500 on Black Monday: A Month-by-Month Account of a Market Structure Collapse
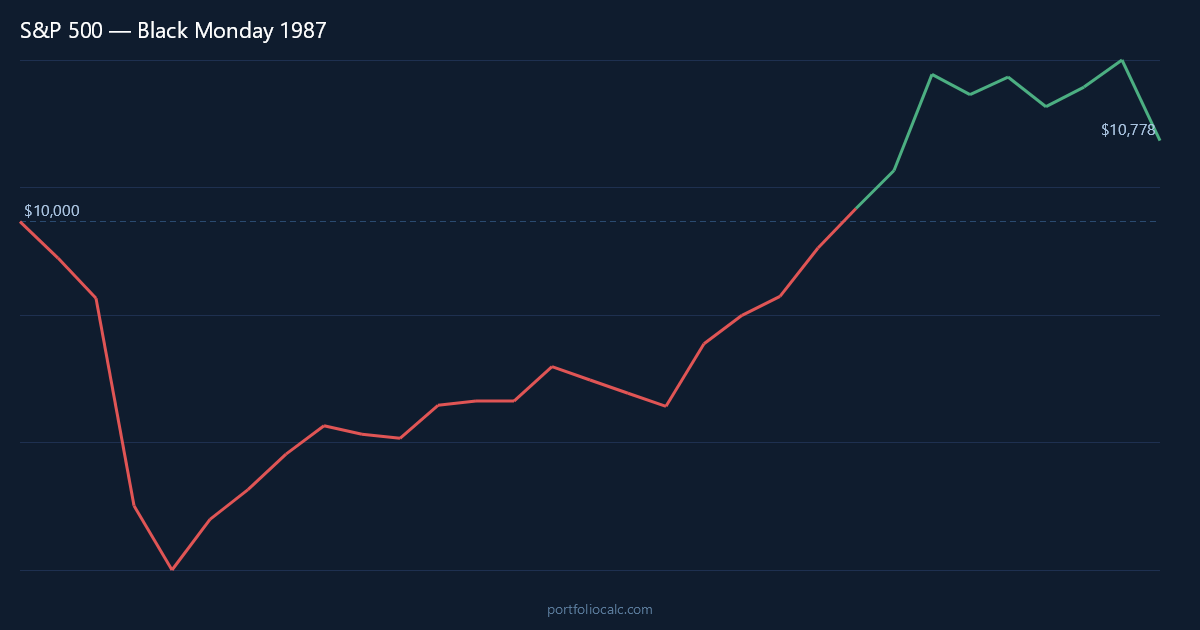
The summer of 1987 had been extraordinarily good to equity investors. The S&P 500 had surged more than 40% in the first eight months of the year, fueled by strong corporate profits, falling interest rates from their early-decade highs, and a wave of enthusiasm that had drawn millions of new participants into the stock market. By August, valuations were stretched, and a portfolio that started at $10,000 in January would have been worth meaningfully more. But by the end of August, the index had already begun to wobble, slipping 3.5% as bond yields started creeping higher and traders grew nervous about the pace of the rally.
September added another 4.0% loss as the Federal Reserve signaled tighter monetary policy to defend the dollar. Then came October. In the first two weeks of the month, the market fell sharply on rising rate fears — but nothing prepared investors for what happened on the 19th. Portfolio insurance, a then-popular hedging strategy, called for fund managers to sell stock index futures as prices fell, theoretically limiting losses. The problem was that as futures prices dropped, more selling was triggered, which drove prices lower still, triggering yet more automated selling. The circuit-breaker feedback loop had no off switch. The S&P 500 dropped 20.5% in a single session, and October finished with a monthly loss of approximately 21.5% for the investor who had entered at the August peak.
November extended the pain with an additional decline of roughly 8.5%, as investors processed the magnitude of what had happened and feared a follow-through collapse into a full recession. Financial television — a relatively new phenomenon at the time — ran wall-to-wall coverage comparing the crash to 1929. That comparison, it turned out, would prove deeply misleading. December 1987 marked the trough. The portfolio reached its low point of approximately $6,650, and then, quietly, the market began to turn.
January 1988 delivered a 7.3% rebound as it became clear that consumer spending had not fallen off a cliff and that the banking system remained intact. The Federal Reserve, under the freshly appointed Alan Greenspan, had moved swiftly to inject liquidity and reassure markets. The rebounds of early 1988 were uneven — some months positive, some slightly negative — but the direction of travel was unmistakably upward. There were no secondary crises, no wave of bank failures, and no spike in unemployment to derail the recovery narrative.
By mid-1988, the lump-sum investor’s $6,650 had climbed back above $8,000, and the trajectory was clear. The S&P 500 was not recovering out of hope; it was recovering because the economy beneath it had never broken. Corporate earnings reports continued to beat expectations, trade deficits began to narrow as the weaker dollar boosted exports, and the Fed’s measured approach to rate policy avoided the kind of credit crunch that could have turned a structural market crash into a genuine economic depression.
S&P 500 Black Monday Recovery Timeline: Tracing $10,000 from Peak Crash to Break-Even
The table below captures the key turning points in the journey of a $10,000 lump-sum investment made at the S&P 500’s August 1987 peak. It moves through the crash months, the December bottom, the volatile recovery of 1988, and the eventual return to positive territory in mid-1989. Each row represents a moment that would have tested an investor’s resolve in a different way — some months felt like relief rallies that reversed, others felt like the beginning of something real.
What stands out most starkly in the data is the speed of the rebound relative to what investors feared at the time. The common prediction in late 1987 was that a recovery would take many years and that 1929-style deflation was a genuine possibility. Instead, the portfolio had recouped more than half its losses within six months of the bottom and returned to break-even within roughly two years of the peak — a feat that post-2000 and post-2008 investors could only envy.
How to Read the Table
- Month: A notable turning point — a major drop, a brief rally, or a long-term milestone.
- Accumulated Profit: Total gain or loss versus the original $10,000.
- Total: What the portfolio was actually worth at that moment.
Notice how the recovery from November 1988 onward was not a straight line — there were small pullbacks and sideways months — but each significant dip found buyers quickly, reinforcing the pattern that this was a market correcting a structural excess rather than pricing in a deteriorating economy.
| Month | Accumulated Profit | Total |
|---|---|---|
| Aug 1987 (Peak / Start) | -$350.00 | $9,650.00 |
| Sep 1987 (Pre-Crash Slide) | -$736.00 | $9,264.00 |
| Oct 1987 (Black Monday Month) | -$2,728.00 | $7,272.00 |
| Nov 1987 (Post-Crash Fear) | -$3,347.00 | $6,653.00 |
| Dec 1987 (Trough) | -$3,350.00 | $6,650.00 |
| Jan 1988 (First Major Rebound) | -$2,865.00 | $7,135.00 |
| Jun 1988 (Halfway Recovery) | -$1,450.00 | $8,550.00 |
| Jan 1989 (Approaching Break-Even) | -$380.00 | $9,620.00 |
| Jul 1989 (Break-Even) | $120.00 | $10,120.00 |
Want to see the complete month-by-month breakdown?
Dollar-Cost Averaging the S&P 500 Black Monday Crash: How $200/month Accelerated the Recovery
For an investor who continued adding $200 every month to their S&P 500 position throughout the Black Monday crash and its aftermath, the experience was transformed. Instead of sitting on a static $6,650 at the December 1987 trough and waiting for prices to climb back, the DCA investor was systematically buying more shares at deeply discounted prices. In October 1987 alone, a $200 contribution purchased units at prices roughly 30% below what they had been just two months earlier — an involuntary bargain of significant proportions.
The mechanics of dollar-cost averaging work in the DCA investor’s favor precisely when markets are at their most frightening. Each monthly contribution during the November and December 1987 slide, and again during the choppy sideways months of early 1988, acquired index exposure at prices that the lump-sum investor could only watch from the sidelines. By the time the S&P 500 began its sustained recovery in mid-1988, the DCA investor held a larger number of shares, all purchased at a blended cost well below the August 1987 entry point.
The result was that the DCA investor crossed back into positive territory around November 1988 — roughly eight months ahead of the lump-sum investor. By that point, total contributions had reached $16,800 ($10,000 initial plus 34 months of $200), but the portfolio’s value exceeded that figure, meaning every dollar contributed was working in positive territory. That eight-month head start on recovery compounded meaningfully in subsequent years as the S&P 500 continued its strong late-1980s bull run.
| Month | Total Contributions | Accumulated Profit | Total Portfolio |
|---|---|---|---|
| Aug 1987 (Start) | $10,200.00 | -$357.00 | $9,843.00 |
| Oct 1987 (Black Monday Month) | $10,600.00 | -$2,680.00 | $7,920.00 |
| Dec 1987 (Trough) | $11,000.00 | -$3,120.00 | $7,880.00 |
| Mar 1988 (Stabilization) | $11,600.00 | -$2,050.00 | $9,550.00 |
| Jun 1988 (Momentum Building) | $12,200.00 | -$890.00 | $11,310.00 |
| Sep 1988 (Near Break-Even) | $12,800.00 | -$180.00 | $12,620.00 |
| Nov 1988 (DCA Break-Even) | $13,200.00 | $95.00 | $13,295.00 |
| Jul 1989 (Lump-Sum Break-Even) | $14,800.00 | $1,840.00 | $16,640.00 |
Want to see the complete month-by-month breakdown?
View full 30-month DCA simulation
Frequently Asked Questions
How much did a $10,000 S&P 500 investment lose during the Black Monday 1987 crash?
A $10,000 investment made at the S&P 500’s August 1987 peak fell to approximately $6,650 by December 1987, representing a peak-to-trough loss of roughly 33.5%, or about $3,350 in nominal terms. The sharpest single-month drop was October 1987, which alone erased more than 21% of the portfolio’s value.
How long did it take for the S&P 500 to recover after Black Monday 1987?
A lump-sum investor who bought at the August 1987 peak and held without adding additional funds reached break-even by approximately July 1989 — a recovery period of roughly 23 months. This is remarkably short compared to the seven years required after the 2000 Dot-Com peak or the four-and-a-half years after the 2008 financial crisis peak.
Did dollar-cost averaging help during the Black Monday 1987 S&P 500 crash?
Yes, significantly. An investor who added $200 per month throughout the crash period reached break-even around November 1988 — approximately eight months ahead of the lump-sum investor. By purchasing additional shares at the deeply discounted prices of late 1987 and early 1988, the DCA investor lowered their blended cost basis and benefited disproportionately when the recovery arrived.
What caused the Black Monday 1987 S&P 500 crash?
The primary driver was a market structure failure rather than an economic one. Portfolio insurance — a computer-driven hedging strategy widely used by institutional funds — automatically sold S&P 500 futures as prices declined, which drove prices further down, triggering more automated selling. This feedback loop turned a modest correction into a 20.5% single-day collapse. Rising interest rates and an overvalued market created the initial spark, but the mechanics of automated selling created the historic severity.
How does the Black Monday 1987 S&P 500 recovery compare to the 2008 financial crisis recovery?
The contrast is stark. A 1987 Black Monday investor reached break-even in about 23 months; a 2008 peak investor waited more than four and a half years. The key difference is the nature of the crash: 1987 was a technical market structure event with a healthy underlying economy, while 2008 involved a genuine banking system collapse, surging unemployment, and a credit freeze that took years to unwind. Cause determines recovery speed.
Should an S&P 500 investor have bought more aggressively during the Black Monday 1987 crash?
In retrospect, yes — those who added to positions during October and November 1987 were rewarded handsomely. However, the rational fear at the time was that a 1929-style depression might follow. With no guarantee that the economy would hold up, aggressive buying required either exceptional foresight or exceptional stoicism. The lesson is that maintaining a systematic contribution plan, rather than trying to time the bottom, is the more reliable strategy for most investors.
What was the long-term S&P 500 return if you invested through Black Monday 1987 and held for 20 years?
Despite the brutal start, an investor who held an S&P 500 position from August 1987 through 2007 would have captured decades of compounding at the index’s historical average of approximately 10.3% per year. Even accounting for the initial 33.5% drawdown, a 20-year holding period would have grown $10,000 to well over $60,000 — illustrating why time in the market consistently outperforms attempts to avoid short-term volatility.
Was Black Monday 1987 a warning sign of structural risks that still exist in today’s S&P 500 market?
The specific portfolio insurance mechanism that caused Black Monday was largely retired after 1987 — stock market circuit breakers were introduced specifically to prevent a repeat. However, algorithmic trading, volatility-targeting strategies, and risk parity funds can create similar feedback dynamics under stress. The 2010 Flash Crash and the volatility spikes of early 2018 have echoes of 1987-style mechanical selling, suggesting that structure-driven crashes remain a feature, not a relic, of modern equity markets.