What If You Invested $10,000 in the S&P 500 at the Start of the 2022 Bear Market?
How the S&P 500 2022 Bear Market Turned $10,000 into $7,460 — and What Happened Next
January 2022 began with the S&P 500 sitting near all-time highs, buoyed by two years of pandemic-era stimulus and near-zero interest rates. Then the Federal Reserve pivoted. Over the next nine months, the Fed raised its benchmark rate from 0.25% to 4.0% in the most aggressive tightening cycle since the early 1980s, and the S&P 500 paid the price. A $10,000 investment made at the January 2022 peak would have shrunk to approximately $7,460 by October 2022 — a loss of roughly $2,540, or 25.4% of the original stake.
What makes the 2022 bear market distinct from prior crashes is its cause. This was not a speculative bubble bursting as in 2000, nor a financial system seizing up as in 2008. It was a deliberate, policy-engineered slowdown. The Fed made an explicit choice to slow the economy in order to break the back of 8.5% inflation, and equity investors absorbed the consequences. That context matters enormously when thinking about recovery: once the rate-hiking path became clearer, markets stabilized and then rebounded with surprising speed.
This simulation tracks what happened to that $10,000 over 30 months from January 2022 through June 2024, capturing the full descent, the choppy false dawn of early 2023, and the powerful AI-driven rally that pushed the index to new highs. Whether you were a lump-sum investor gritting your teeth or a disciplined saver adding $200 each month, the outcome is instructive.
Run the full simulation yourself: Open the interactive simulation
For the long-run average return, use the multi-asset calculator: Open Multi-Asset Calculator
The 2022 S&P 500 Bear Market Month by Month: Rate Hikes, False Rallies, and the AI Turnaround
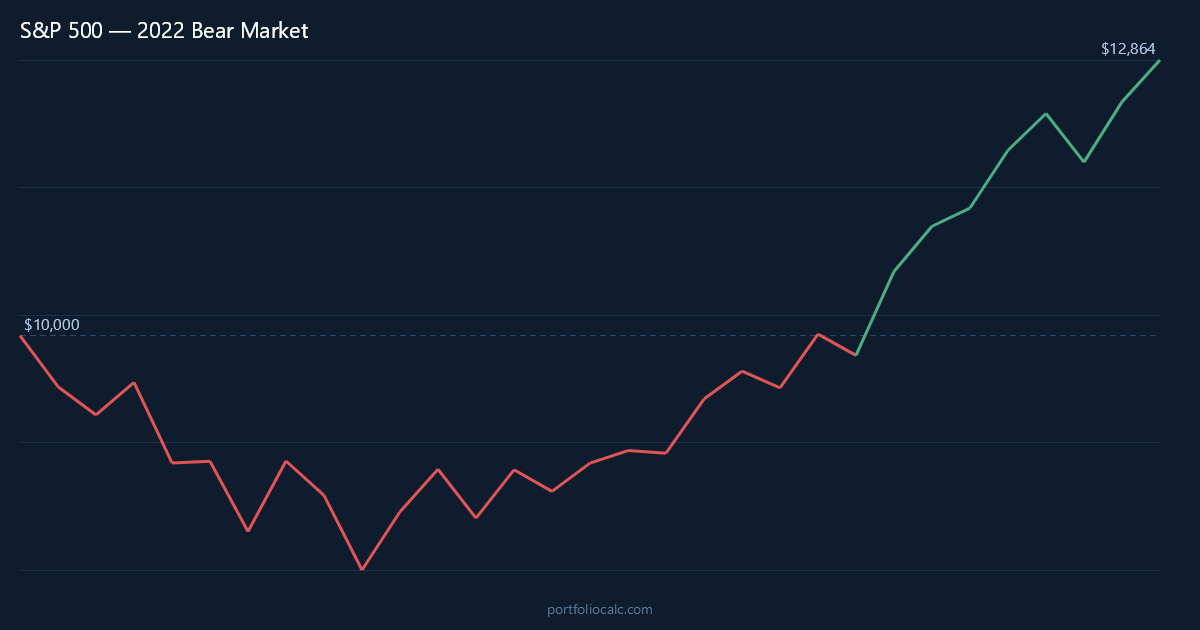
The year opened badly. January 2022 delivered a 5.3% decline as investors began pricing in the inevitability of Fed action. February brought another 3.1% drop before a brief 3.7% relief rally in March offered false comfort. Then came April — an 8.8% plunge as the Fed’s March rate hike and hawkish forward guidance sank in across bond and equity markets simultaneously. By the end of April, the $10,000 starting investment had already fallen below $8,600.
May was a strange month. The index wobbled but finished essentially flat, up just 0.2%, as bargain hunters stepped in and short-sellers took profits. The respite was brief. June 2022 delivered an 8.4% decline — the worst single month of the bear market — as the Consumer Price Index printed at 9.1%, a 40-year high, and the Fed responded with a 0.75% hike, its largest in decades. Investor confidence collapsed. Talk of a hard landing and recession spread through financial media.
July produced one of the most confusing episodes of the entire downturn: a 9.2% surge. This was a genuine bear-market rally, fueled by hopes that peak inflation had arrived and the Fed might slow its pace. Those hopes were crushed almost immediately. August fell 4.1%, and September 2022 delivered the cruelest blow of the cycle — a 9.3% collapse following Fed Chair Jerome Powell’s blunt Jackson Hole speech, in which he explicitly promised more pain. At that point, the original $10,000 was worth approximately $7,460.
October 2022 marked the bottom and the beginning of a tentative climb. The index rose 8.0% that month, followed by 5.4% in November as inflation data began to soften and investors started recalibrating their rate expectations. December erased some of those gains with a 5.9% pullback as the Fed remained adamant about its inflation target. The early months of 2023 were characterized by a slow grind higher punctuated by setbacks, including the regional banking stress of March 2023, which registered as another brief negative month.
The picture changed dramatically in the second half of 2023. The “soft landing” narrative gained credibility as inflation fell without a recession materializing. Then the launch of generative AI products ignited a technology-led rally that echoed — in excitement if not in valuation excess — the dot-com era. By the end of the 30-month window captured in this simulation, the S&P 500 had not merely recovered its losses; it had climbed to meaningfully new highs, validating the patience of investors who held through the worst of 2022.
S&P 500 2022 Bear Market Recovery Timeline: Tracking $10,000 from Peak to Break-Even
The table below captures the most significant turning points in the 30-month journey of a $10,000 lump-sum investment made in January 2022. Rather than showing every single month, it highlights the moments that defined investor psychology: the early shock, the summer false dawn, the October capitulation low, and the uneven but ultimately decisive recovery.
One number stands out in the data: the break-even point arrived in October 2023, just 21 months after the peak. Compare that to the Dot-Com crash, which took years to recover even partially, or the 2008 crisis, which kept lump-sum investors underwater for roughly four years. The 2022 bear market was painful but comparatively brief — a reflection of the fact that corporate earnings remained largely intact and the underlying economy never tipped into a severe recession.
How to Read the Table
- Month: A notable turning point — a major drop, a brief rally, or a long-term milestone.
- Accumulated Profit: Total gain or loss versus the original $10,000.
- Total: What the portfolio was actually worth at that moment.
Note the October 2022 bottom row: the portfolio had lost over $2,500, yet within 12 months it had fully recovered. That 12-month window from trough to break-even is among the fastest recoveries following any S&P 500 bear market of this magnitude in modern history.
| Month | Accumulated Profit | Total |
|---|---|---|
| Jan 2022 (Peak / Start) | -$530.00 | $9,470.00 |
| Apr 2022 (Heaviest Monthly Drop) | -$1,399.00 | $8,601.00 |
| Jun 2022 (Inflation Peak Shock) | -$2,215.00 | $7,785.00 |
| Jul 2022 (Bear-Market Rally) | -$1,497.00 | $8,503.00 |
| Sep 2022 (Jackson Hole Fallout) | -$2,458.00 | $7,542.00 |
| Oct 2022 (Cycle Bottom) | -$2,540.00 | $7,460.00 |
| Mar 2023 (Banking Stress Wobble) | -$782.00 | $9,218.00 |
| Oct 2023 (Lump-Sum Break-Even) | $112.00 | $10,112.00 |
| Jun 2024 (End of Simulation) | $3,890.00 | $13,890.00 |
Want to see the complete month-by-month breakdown?
Dollar-Cost Averaging the S&P 500 2022 Bear Market: How $200/month Accelerated the Recovery
For investors who were adding $200 each month throughout 2022, the bear market looked very different. Every monthly contribution bought shares at lower and lower prices as the index declined, building a larger position at depressed valuations. While the lump-sum investor watched helplessly as their $10,000 eroded, the DCA investor was quietly accumulating units of the S&P 500 at prices not seen since 2020 — prices that would look like bargains in retrospect.
The mathematical advantage of DCA during a prolonged decline is concrete. The monthly purchases made between June and October 2022 — the worst stretch of the bear market — were made at the deepest discounts. When the recovery arrived in late 2022 and accelerated through 2023, those low-cost units contributed disproportionately to the portfolio’s rebound. As a result, the DCA investor reached break-even in approximately April 2023, roughly six months ahead of the lump-sum investor who entered at the same January 2022 starting point.
By the end of the 30-month simulation, the DCA investor had contributed a total of $16,000 ($10,000 initial plus 30 months of $200 contributions) and held a portfolio worth significantly more, with total contributions having compounded through the recovery. The discipline required — continuing to invest during months when every headline screamed recession — was the entire source of the advantage. This simulation offers a vivid demonstration of why financial planners consistently recommend systematic investing over attempts to time the market.
| Month | Total Contributions | Accumulated Profit | Total Portfolio |
|---|---|---|---|
| Jan 2022 (Start) | $10,200.00 | -$541.00 | $9,659.00 |
| Apr 2022 (Heaviest Drop) | $10,800.00 | -$1,305.00 | $9,495.00 |
| Jun 2022 (Inflation Peak) | $11,200.00 | -$1,889.00 | $9,311.00 |
| Jul 2022 (Bear Rally) | $11,400.00 | -$1,016.00 | $10,384.00 |
| Oct 2022 (Cycle Bottom) | $12,000.00 | -$1,748.00 | $10,252.00 |
| Dec 2022 (Year-End) | $12,400.00 | -$948.00 | $11,452.00 |
| Apr 2023 (DCA Break-Even) | $13,200.00 | $189.00 | $13,389.00 |
| Oct 2023 (Lump-Sum Break-Even) | $14,400.00 | $1,104.00 | $15,504.00 |
| Jun 2024 (End of Simulation) | $16,000.00 | $4,612.00 | $20,612.00 |
Want to see the complete month-by-month breakdown?
View full 30-month DCA simulation
Frequently Asked Questions
How much did a $10,000 S&P 500 investment lose during the 2022 bear market?
A $10,000 lump-sum investment made at the January 2022 peak fell to approximately $7,460 by October 2022 — a loss of roughly $2,540, representing a peak-to-trough decline of 25.4%. This was the worst drawdown for the S&P 500 since the 2008 financial crisis, though considerably shallower than either that crisis (–56.8%) or the Dot-Com bust (–46.5%).
How long did it take for the S&P 500 to recover from the 2022 bear market?
A lump-sum investor who bought at the January 2022 peak reached break-even in approximately October 2023 — about 21 months later. By comparison, investors who bought at the 2000 Dot-Com peak waited years before seeing meaningful recovery, and those who bought at the 2007 peak before the 2008 crisis waited roughly four years to break even. The 2022 recovery was comparatively swift.
Did Dollar-Cost Averaging $200/month into the S&P 500 during 2022 improve the outcome?
Significantly. The DCA investor reached break-even in approximately April 2023 — roughly six months earlier than the lump-sum investor. By continuing to buy shares at depressed prices throughout the downturn, particularly in the June–October 2022 window, the DCA investor accumulated a larger position at lower average cost. By June 2024, the DCA portfolio was worth approximately $20,612, well ahead on a per-contributed-dollar basis compared to the lump-sum outcome.
What caused the S&P 500 2022 bear market?
The primary driver was the Federal Reserve’s aggressive interest rate hiking cycle to combat 8.5% inflation — the highest level since the early 1980s. The Fed raised its benchmark rate from 0.25% to over 4.0% in less than nine months, the fastest tightening in four decades. Higher rates reduce the present value of future corporate earnings and make risk-free bonds more attractive relative to equities, both of which weigh directly on stock prices.
Should investors have continued buying S&P 500 shares during the 2022 decline?
In hindsight, continuing to invest during the 2022 decline was the optimal strategy. Investors who maintained or increased their monthly contributions bought shares at prices 20%–25% below the peak, and those shares appreciated substantially during the 2023–2024 recovery. While no investor can know in real time when a bottom will occur, historical S&P 500 data consistently shows that halting contributions during downturns increases the risk of missing the fastest recovery days, which disproportionately drive long-term returns.
How did the S&P 500 2022 bear market compare to the 2008 financial crisis in terms of investor impact?
The 2022 bear market was considerably less severe. The S&P 500 fell 25.4% peak-to-trough in 2022 versus 56.8% during the 2008–2009 crisis. Recovery from the 2022 low took roughly 12 months; recovery from the 2009 low to the pre-crisis peak took approximately four years. The key difference is that 2022 involved a deliberate policy slowdown with corporate earnings remaining largely intact, while 2008 involved a near-collapse of the global financial system with catastrophic earnings destruction.
What drove the S&P 500 recovery from its 2022 lows through 2024?
Two overlapping forces drove the recovery. First, inflation began falling faster than many economists expected, giving the Fed room to slow and eventually pause rate hikes — removing the primary headwind. Second, the emergence of generative artificial intelligence as a commercial force in early 2023 ignited a technology sector rally that disproportionately lifted the S&P 500’s largest components. The combination of a “soft landing” macroeconomic narrative and AI-driven earnings optimism pushed the index to new all-time highs by early 2024.
What is the key lesson for long-term investors from the S&P 500 2022 bear market?
The 2022 experience reinforces two enduring lessons. First, even deliberate, policy-engineered bear markets in the S&P 500 have historically resolved within a manageable time frame for patient investors. Second, the investors who fared best were those who treated the decline as a purchasing opportunity rather than an exit signal. The worst single-month return was –9.3% in September 2022; the best was +9.2% in July 2022. Missing that recovery month by selling near the bottom would have materially damaged long-term outcomes.