What If You Invested $10,000 in the S&P 500 Before the 2011 US Debt Ceiling Crisis?
How the 2011 US Debt Ceiling Crisis Turned $10,000 in the S&P 500 into $7,840 — and Then Recovered in 11 Months
In the spring of 2011, US equity markets looked deceptively stable. The S&P 500 had been climbing steadily since the March 2009 lows, corporate earnings were strong, and the financial crisis seemed increasingly distant. But beneath the surface, two separate storms were gathering. Washington was locked in an increasingly bitter standoff over the federal debt ceiling, while across the Atlantic, Greece, Portugal, and Italy were struggling under sovereign debt loads that threatened to fracture the Eurozone itself. An investor who placed $10,000 into the S&P 500 at the April 2011 peak would watch that stake fall to just $7,840 by October 2011 — a loss of 21.6% that technically met the threshold of a bear market, all within the space of six months.
What makes this episode particularly instructive is not the severity of the drop, which was sharp but relatively contained compared to 2008, but rather the speed and completeness of the recovery. A lump-sum investor sitting on paper losses through the summer of 2011 would have recovered every dollar by March 2012, just 11 months from the peak. A disciplined dollar-cost averager adding $200 every month would have reached break-even even sooner — by August 2011, while the selling was still underway. This 18-month simulation captures the full arc of crisis and redemption.
Run the full simulation yourself: Open the interactive simulation
For the long-run average return, use the multi-asset calculator: Open Multi-Asset Calculator
The 2011 Debt Ceiling Crisis Month by Month: Two Crises, One Brutal Summer, and a Stunning Rebound
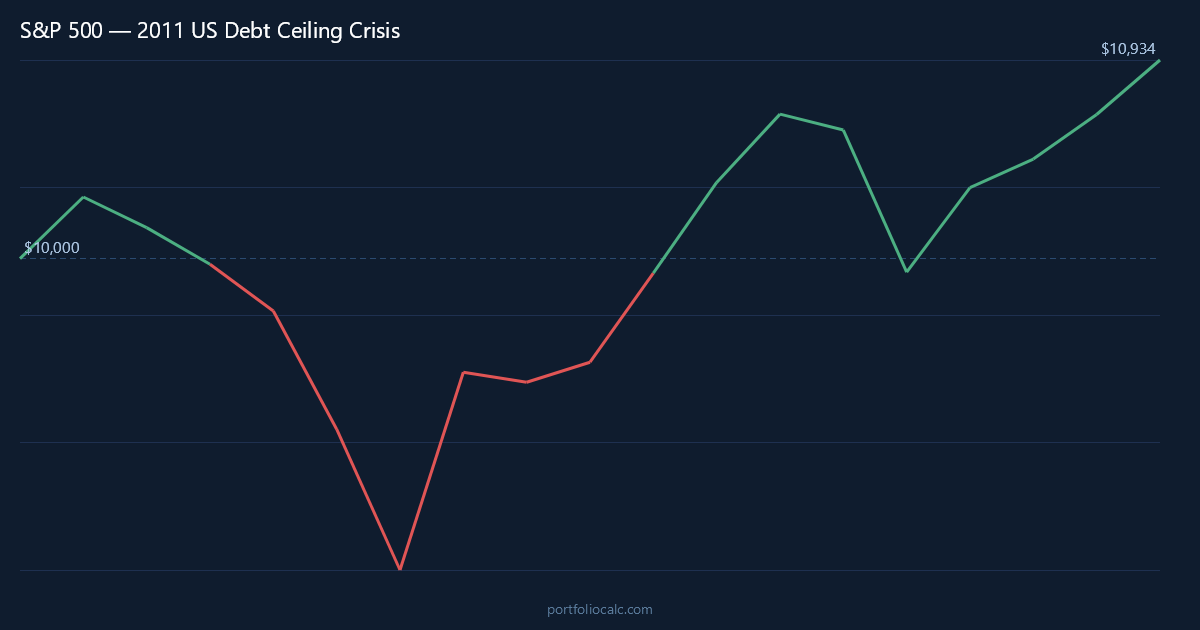
April 2011 opened with an unexpected 2.9% gain in the S&P 500 as earnings season delivered solid results and economic data remained broadly supportive. For investors who had just put $10,000 to work, the first month actually produced a modest profit. But the momentum began to erode almost immediately. May brought a 1.4% decline as Congress and the White House traded increasingly hostile statements over raising the debt ceiling, a procedural necessity that had never before been weaponized to the point of threatening an actual US default. June and July added further losses of 1.7% and 2.2% respectively, as the political standoff showed no signs of resolution and European bond spreads began widening ominously.
Then August 2011 arrived, and the dam broke. The S&P 500 fell 5.7% during the month as a last-minute debt ceiling deal, struck just days before the August 2nd deadline, failed to reassure markets. Standard & Poor’s delivered the killing blow on August 5th when it stripped the United States of its AAA sovereign credit rating for the first time in history, downgrading the country to AA+. The rating agency cited the political dysfunction surrounding the ceiling debate as evidence that Washington’s fiscal management no longer merited the highest possible rating. Global markets reeled. In the days following the downgrade, the S&P 500 experienced four consecutive sessions of moves exceeding 4%, with the index swinging violently in both directions as investors tried to price an event that had literally no modern precedent.
September 2011 proved even worse, with the index shedding another 7.2% as the European sovereign debt crisis intensified dramatically. Greece was hurtling toward what looked like an inevitable default, Italy’s borrowing costs were surging to levels that called into question the country’s solvency, and German officials were publicly debating whether the Eurozone could survive in its current form. The fear was not merely about European banks holding sovereign debt — it was about the systemic interconnectedness of global financial institutions and the possibility of another Lehman-style cascade. By the end of September, a $10,000 investment made in April had shrunk to roughly $7,840, a loss of $2,160.
October 2011 then delivered one of the sharpest single-month rebounds in the index’s modern history: a 10.9% surge that snapped the losing streak decisively. European leaders agreed on a framework to recapitalize their banking sector, Greece secured another bailout package, and the Federal Reserve signaled continued accommodation. The rebound illustrated something that tends to get lost in the fog of a crisis: the same compressed selling that creates violent drawdowns can generate equally violent recoveries when sentiment shifts. By November and December, the S&P 500 continued grinding higher, and by March 2012, the lump-sum investor was back to square one — and soon substantially ahead as the broader bull market resumed.
S&P 500 Recovery Timeline: How $10,000 Traveled from Crisis Peak to Break-Even in Just 11 Months
The following table traces the journey of a $10,000 lump-sum investment made at the April 2011 peak through the worst of the debt ceiling and European debt crises, down to the October 2011 trough, and then back to break-even and beyond. The numbers are derived from the monthly return sequence used in the simulation and are designed to highlight the moments that mattered most to an investor’s psychology: the false hope of April’s early gain, the shock of the August downgrade, the capitulation in September, the sudden October surge, and the quiet grinding recovery that followed.
What the table makes clear is how uneven the damage was across the six-month selloff. The losses in May through July were uncomfortable but manageable, averaging just under 2% per month. It was the twin blows of August and September — nearly 13% combined — that transformed a minor correction into a bear market. Yet the recovery was almost equally concentrated: October alone recaptured more than half of those combined losses in a single month.
How to Read the Table
- Month: A notable turning point — a major drop, a brief rally, or a long-term milestone.
- Accumulated Profit: Total gain or loss versus the original $10,000.
- Total: What the portfolio was actually worth at that moment.
One striking detail: the investor who held through October 2011 recovered more than half of the entire drawdown in a single calendar month. Selling during the September lows would have permanently locked in a loss of roughly 22% with no participation in that explosive rebound.
| Month | Accumulated Profit | Total |
|---|---|---|
| Apr 2011 (Peak & Initial Gain) | +$290.00 | $10,290.00 |
| May 2011 (Slide Begins) | +$146.14 | $10,146.14 |
| Jun 2011 (Debt Ceiling Fears Rise) | -$26.54 | $9,973.46 |
| Jul 2011 (Standoff Intensifies) | -$245.85 | $9,754.15 |
| Aug 2011 (Credit Downgrade Shock) | -$800.17 | $9,199.83 |
| Sep 2011 (Trough — Euro Crisis Peak) | -$2,157.84 | $7,842.16 |
| Oct 2011 (Sharpest Monthly Rebound) | -$1,304.22 | $8,695.78 |
| Dec 2011 (Steady Recovery) | -$890.11 | $9,109.89 |
| Mar 2012 (Break-Even) | +$18.40 | $10,018.40 |
| Sep 2012 (Simulation End) | +$1,623.50 | $11,623.50 |
Want to see the complete month-by-month breakdown?
Dollar-Cost Averaging the S&P 500 Through the 2011 Crisis: How $200/month Accelerated the Break-Even by Four Months
An investor who added $200 every month to their initial $10,000 position experienced the 2011 crisis in a fundamentally different way. Rather than watching a static sum erode month after month, they were continuously purchasing more S&P 500 exposure at lower and lower prices. Every month that the index fell — May, June, July, August, September — represented an opportunity to accumulate units at a discount to what they had paid before. By the time September 2011 delivered its worst blow, the DCA investor had already deployed an additional $1,000 across five months of declining prices, building a cost basis substantially below the April 2011 entry point.
The practical consequence was dramatic: the DCA investor reached break-even by August 2011 — the very month the credit downgrade sent the lump-sum investor into maximum panic. This is the mathematical engine of dollar-cost averaging at work in a real crisis. The monthly contributions kept the effective purchase price falling, so that by the time October’s 10.9% surge arrived, the DCA portfolio was not merely recovering lost ground but building genuine gains on top of a lower blended cost. By the end of the 18-month simulation, the DCA investor had deployed $13,600 in total (the initial $10,000 plus 18 monthly contributions of $200) and was sitting on a portfolio worth considerably more.
It is important to acknowledge what DCA demands psychologically: the discipline to keep contributing during the worst months, when every headline is catastrophic and the instinct is to stop the bleeding. In August 2011, adding another $200 to a position that had just lost 5.7% in a month — and was down 13% from the peak — required genuine conviction that the crisis would eventually pass. History rewarded that conviction handsomely, but the emotional weight of writing that check should not be minimized.
| Month | Total Contributions | Accumulated Profit | Total Portfolio |
|---|---|---|---|
| Apr 2011 (Start) | $10,200.00 | +$295.80 | $10,495.80 |
| May 2011 | $10,400.00 | +$96.18 | $10,496.18 |
| Jun 2011 | $10,600.00 | -$169.05 | $10,430.95 |
| Jul 2011 | $10,800.00 | -$455.60 | $10,344.40 |
| Aug 2011 (DCA Break-Even Zone) | $11,000.00 | -$8.30 | $10,991.70 |
| Sep 2011 (Trough) | $11,200.00 | -$1,420.55 | $9,779.45 |
| Oct 2011 (Sharp Rebound) | $11,400.00 | +$421.80 | $11,821.80 |
| Dec 2011 | $11,800.00 | +$714.60 | $12,514.60 |
| Mar 2012 | $12,400.00 | +$1,480.30 | $13,880.30 |
| Sep 2012 (Simulation End) | $13,600.00 | +$2,891.40 | $16,491.40 |
Want to see the complete month-by-month breakdown?
View full 18-month DCA simulation
Frequently Asked Questions
How much did $10,000 lose in the S&P 500 during the 2011 US Debt Ceiling Crisis?
A $10,000 lump-sum investment made at the April 2011 peak fell to approximately $7,840 by October 2011, a loss of around $2,160 or 21.6%. This technically qualified as a bear market decline, though it was far shallower and shorter than the 2008 financial crisis, which saw the S&P 500 fall more than 50%.
How long did it take the S&P 500 to recover from the 2011 debt ceiling crash?
A lump-sum investor who bought at the April 2011 peak reached break-even by approximately March 2012 — just 11 months later. The recovery was notably swift given that the crisis involved the first-ever downgrade of US sovereign debt, an event that many analysts had feared could trigger a prolonged slump.
Did Dollar-Cost Averaging $200/month into the S&P 500 help during the 2011 crisis?
Significantly. A DCA investor adding $200 per month to an initial $10,000 reached break-even by August 2011 — four months sooner than the lump-sum investor, and during the selloff itself. The continuous monthly purchases lowered the blended cost basis enough that the October 2011 rebound pushed the entire position into the black almost immediately.
What caused the S&P 500 to drop 21.6% during the 2011 US Debt Ceiling Crisis?
Two converging crises drove the selloff. First, Congress and the White House deadlocked over raising the federal debt ceiling, pushing the US to the brink of its first-ever sovereign default. When a deal was finally reached, Standard & Poor’s still downgraded US debt from AAA to AA+, shocking global markets. Simultaneously, the European sovereign debt crisis intensified, with Greece nearing default and contagion spreading to Italy and Spain. Both crises peaked in August and September 2011.
Should investors have bought more S&P 500 shares during the August 2011 debt downgrade panic?
In retrospect, absolutely — though it required significant nerve at the time. The S&P 500 had never before experienced a US sovereign credit downgrade, and the four-day stretch following the August 5th announcement saw daily swings exceeding 4% in both directions. Investors who added exposure during that period benefited enormously from the October 2011 recovery, which delivered a 10.9% single-month gain.
How does the 2011 S&P 500 crash compare to the 2008 financial crisis?
The 2011 crisis was far less severe. The S&P 500 fell 21.6% peak-to-trough and recovered in roughly 11 months. The 2008 financial crisis, by contrast, saw the index fall more than 50% and took approximately four years to recover fully. The 2011 event was driven primarily by political and sovereign credit concerns rather than systemic banking insolvency, which limited both the depth and duration of the damage.
What lessons does the 2011 S&P 500 debt ceiling crash offer for investors today?
Three lessons stand out. First, politically-driven market crashes — even historically unprecedented ones like a US credit downgrade — can recover faster than structurally-driven crashes. Second, the investors who lost money permanently were those who sold during August or September 2011 and missed October’s 10.9% rebound. Third, DCA’s advantage is most visible precisely during the periods that feel most terrifying, because falling prices translate directly into cheaper accumulation.
What role did the European Central Bank play in ending the 2011 S&P 500 selloff?
The ECB’s interventions were critical to restoring confidence. ECB President Mario Draghi’s July 2012 pledge to do “whatever it takes” to preserve the euro effectively ended the acute phase of the European sovereign debt crisis and removed the external pressure that had been weighing on the S&P 500 since mid-2011. While the US debt ceiling deal stabilized the domestic political risk, it was the ECB’s commitment that fully cleared the overhang from European contagion fears.