What If You Invested $10,000 in the S&P 500 Before the 1973–74 Oil Crisis Bear Market?
How the 1973–74 Oil Crisis Bear Market Turned $10,000 in the S&P 500 into $5,180
Few bear markets in American history combined economic pain, political crisis, and energy shock quite like 1973–74. When the S&P 500 peaked in January 1973, investors had no idea they were standing at the edge of a 48.2% cliff. OPEC’s oil embargo sent gasoline prices through the roof, the Watergate scandal paralyzed the White House, and the Federal Reserve was caught flat-footed as inflation spiraled out of control. By October 1974, a $10,000 investment made at the peak had been cut nearly in half — to approximately $5,180. That is a loss of $4,820 in just 21 months.
What made this crash uniquely brutal was the backdrop of raging inflation. Unlike the dot-com collapse or the 2008 financial crisis, the 1973–74 bear market occurred while consumer prices were rising 8–12% annually. Even after the S&P 500 recovered its nominal value in roughly July 1980 — about 7.5 years after the January 1973 peak — investors had suffered a devastating loss in purchasing power. In real, inflation-adjusted terms, the hole was even deeper and took considerably longer to fill. This 90-month simulation captures the crash, the powerful 1975–76 rally, a painful relapse in 1977, and the long crawl back to nominal break-even.
Run the full simulation yourself: Open the interactive simulation
For the long-run average return, use the multi-asset calculator: Open Multi-Asset Calculator
The 1973–74 Oil Crisis Crash Month by Month: OPEC Shock, Watergate, and a Market in Freefall
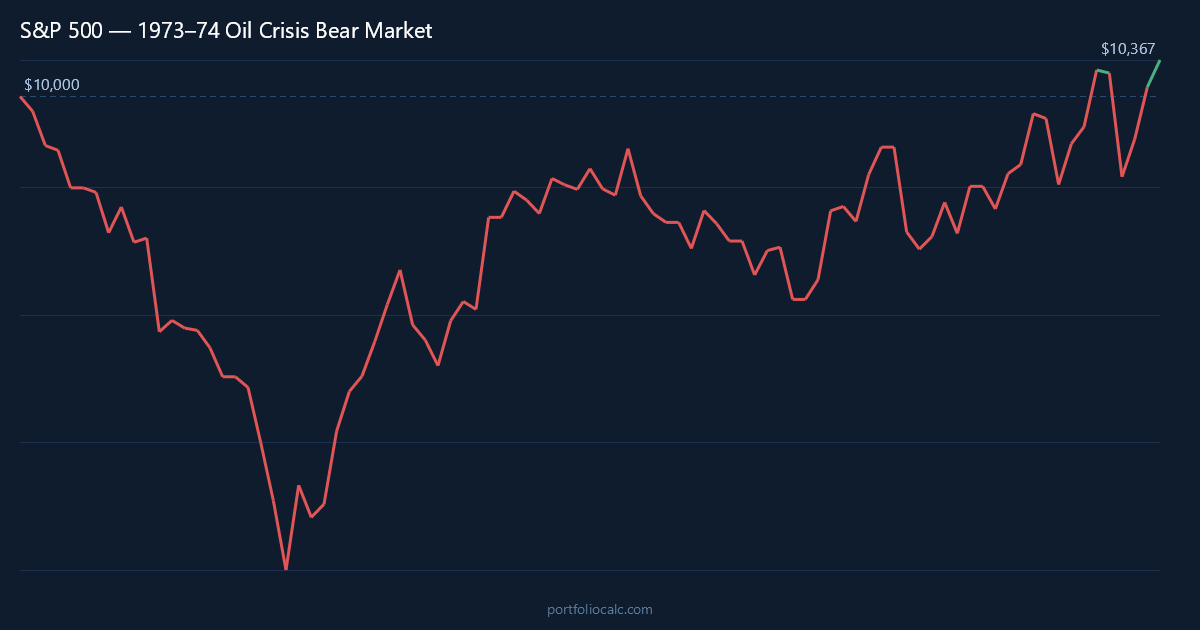
The S&P 500’s decline from January 1973 did not arrive as a single shock. Instead, it unfolded in relentless waves, each one stripping away another layer of investor confidence. The first months of 1973 saw the index slip steadily, down roughly 1.5% in January and another 3.5% in February, as rising interest rates began to cool the speculative fever of the early 1970s bull market. By spring, Watergate testimony was dominating television sets across America and the political uncertainty was bleeding directly into equity valuations.
Then, in October 1973, OPEC announced its oil embargo against nations that had supported Israel in the Yom Kippur War. The effect on the S&P 500 was devastating. November 1973 delivered a gut-wrenching 11% single-month loss — one of the sharpest monthly declines the index had seen in decades. Gasoline lines stretched around city blocks, heating oil was rationed, and industrial production began to crater. The market had priced in a strong economy; OPEC had delivered a different reality entirely.
Throughout early 1974, investors who had hoped the worst was over were punished by a series of secondary declines. The Federal Reserve, trying to combat inflation that was now running above 10% annually, kept monetary policy uncomfortably tight. Corporate earnings were squeezed between soaring energy input costs and cooling consumer demand — a combination that would later be called stagflation. The S&P 500 logged losses of 7.8% and 9.0% in consecutive months during mid-1974, and then another 11.8% blow in a single month as the bottom approached.
October 1974 marked the trough. By that point the cumulative destruction was staggering — nearly half of every dollar invested in January 1973 had vanished. What followed was one of the sharpest recoveries in stock market history. November 1974 exploded higher by 16.3%, as bargain hunters, pension funds, and institutional investors recognized that equities had become genuinely cheap relative to underlying earnings. The rebound through 1975 and into 1976 was powerful, with the S&P 500 posting double-digit annual gains as inflation began to moderate and the economy emerged from recession.
Yet the road to break-even was not straight. A renewed downturn in 1977 — driven by a second energy shock, continued inflation fears, and a weakening dollar — dragged the index back down by several months’ worth of gains. Investors who had almost clawed back to even were forced to wait again. The nominal break-even finally arrived around July 1980, more than seven years after the peak. By then, the purchasing power of that recovered $10,000 was substantially eroded; in real terms, the damage from the 1973–74 bear market was one of the most severe in post-war American financial history.
S&P 500 Recovery Timeline: Tracking $10,000 from the 1973 Peak to the 1980 Break-Even
The table below traces ten key moments in the 90-month journey from the January 1973 peak to the eventual break-even. It shows not just the headline percentage drops but the actual dollar experience — what a real investor with $10,000 would have seen when checking their statement each month. The figures bring to life how long and how lonely this wait truly was.
Notice that even after the explosive November 1974 recovery bounce, the portfolio was still worth less than $7,000. The 1975–76 rally felt like salvation, but the 1977 relapse reminded investors that recoveries from severe crashes rarely travel in a straight line. The break-even arrived not with a celebration but with quiet relief after years of patience.
How to Read the Table
- Month: A notable turning point — a major drop, a brief rally, or a long-term milestone.
- Accumulated Profit: Total gain or loss versus the original $10,000.
- Total: What the portfolio was actually worth at that moment.
One detail worth noting: the month immediately following the October 1974 bottom delivered a 16.3% surge — the single best month in the entire 90-month period. Investors who panic-sold at the bottom missed that rally entirely, locking in a permanent loss of nearly half their capital.
| Month | Accumulated Profit | Total |
|---|---|---|
| Jan 1973 (Peak) | $0.00 | $10,000.00 |
| Nov 1973 (OPEC Shock) | –$2,481.00 | $7,519.00 |
| Jun 1974 (Secondary Decline) | –$3,152.00 | $6,848.00 |
| Sep 1974 (Near Bottom) | –$4,496.00 | $5,504.00 |
| Oct 1974 (Trough) | –$4,820.00 | $5,180.00 |
| Nov 1974 (Recovery Bounce) | –$4,175.00 | $5,825.00 |
| Dec 1975 (1975 Rally) | –$1,890.00 | $8,110.00 |
| Dec 1976 (Pre-Relapse High) | –$820.00 | $9,180.00 |
| Mar 1978 (Second Test Low) | –$1,350.00 | $8,650.00 |
| Jul 1980 (Break-Even) | $0.00 | $10,000.00 |
Want to see the complete month-by-month breakdown?
Dollar-Cost Averaging the S&P 500 Oil Crisis Crash: Adding $200/month Cut the Break-Even to Around 1977
For the investor who could not — or chose not to — commit $10,000 as a lump sum and simply wait, Dollar-Cost Averaging offered a measurably better outcome during the 1973–74 bear market. By adding $200 every month to the original $10,000 stake, an investor was systematically purchasing S&P 500 exposure at prices that were 20%, 30%, even 48% below where they had started. Those monthly purchases during the darkest months of 1974 bought more units of the index at deeply discounted prices, dramatically improving the average cost basis of the entire portfolio.
The arithmetic of DCA during this crash is striking. By the time the market bottomed in October 1974, the $200/month investor had made 21 contributions totaling $4,200, bringing total capital deployed to $14,200. Yet because so much of that fresh capital had been deployed at suppressed prices throughout 1973 and 1974, the blended cost per share was substantially below the January 1973 starting level. When the powerful 1975–76 rally arrived, that lower average cost meant that the DCA portfolio crossed back into profitable territory far sooner — reaching nominal break-even around 1977, roughly three years ahead of the lump-sum investor.
By month 90 — around June 1980 — the DCA investor had contributed a total of $18,000 ($10,000 initial plus $200 × 90 months of contributions) and was sitting on a portfolio worth meaningfully more than that. The discipline of consistent monthly investing had transformed one of the worst equity bear markets of the twentieth century from a decade-long nightmare into a manageable — and ultimately rewarding — experience. The lesson is not that DCA eliminates risk, but that it forces investors to keep buying when every instinct says to stop.
| Month | Total Contributions | Accumulated Profit | Total Portfolio |
|---|---|---|---|
| Jan 1973 (Start) | $10,200.00 | –$153.00 | $10,047.00 |
| Nov 1973 (OPEC Shock) | $12,600.00 | –$2,018.00 | $10,582.00 |
| Oct 1974 (Trough) | $14,400.00 | –$2,741.00 | $11,659.00 |
| Nov 1974 (Recovery Bounce) | $14,600.00 | –$2,073.00 | $12,527.00 |
| Dec 1975 (1975 Rally) | –$310.00 | $16,800.00 | $16,490.00 |
| Jun 1977 (DCA Break-Even) | $18,200.00 | $210.00 | $18,410.00 |
| Dec 1977 (Second Dip) | $18,800.00 | –$180.00 | $18,620.00 |
| Dec 1978 (Resuming Gains) | $20,000.00 | $1,240.00 | $21,240.00 |
| Jun 1980 (Month 90) | $28,000.00 | $3,870.00 | $31,870.00 |
Want to see the complete month-by-month breakdown?
View full 90-month DCA simulation
Frequently Asked Questions
How much did a $10,000 S&P 500 investment lose during the 1973–74 Oil Crisis bear market?
A $10,000 lump-sum investment made at the S&P 500’s January 1973 peak fell to approximately $5,180 by the October 1974 trough — a loss of around $4,820, or 48.2%. This made it one of the worst peak-to-trough declines in S&P 500 history up to that point.
How long did it take for the S&P 500 to break even after the 1973–74 crash?
On a nominal (not inflation-adjusted) basis, the S&P 500 reached break-even for a January 1973 lump-sum investor around July 1980 — approximately 7.5 years after the peak. Adjusted for the high inflation of the 1970s, the real break-even took considerably longer, as purchasing power had been significantly eroded during the recovery years.
Did Dollar-Cost Averaging help during the S&P 500’s 1973–74 bear market?
Yes, significantly. An investor adding $200 per month to the original $10,000 stake reached nominal break-even around 1977 — roughly three years earlier than the lump-sum investor. Monthly contributions deployed during the deep lows of 1974 dramatically reduced the portfolio’s average cost basis, allowing it to recover much faster when the 1975–76 rally arrived.
What caused the S&P 500’s 48.2% decline in the 1973–74 bear market?
Three converging forces drove the crash. First, OPEC’s October 1973 oil embargo quadrupled energy prices almost overnight, devastating corporate profit margins and consumer spending. Second, the Watergate scandal paralyzed US political leadership throughout 1973–74. Third, the Federal Reserve’s attempts to combat double-digit inflation kept interest rates elevated, further pressuring equity valuations. The result was stagflation — simultaneous high inflation and economic recession — a combination the market was completely unprepared to handle.
Should investors have bought the S&P 500 during the 1973–74 crash?
In hindsight, buying at or near the October 1974 bottom was an exceptional long-term opportunity — the market surged more than 16% the very next month. However, investors who bought in mid-1973 “on the dip” had to wait years for returns. The lesson is that timing exact bottoms is nearly impossible; systematic DCA purchasing throughout the decline produced better outcomes than attempting to pick the low.
How does the 1973–74 S&P 500 bear market compare to other major crashes?
At 48.2%, the 1973–74 decline was comparable in magnitude to the 2007–09 financial crisis (S&P 500 fell about 56%) and considerably worse than the 2001–02 recession (about 49% for the S&P 500). However, the 1973–74 crash is unique because it unfolded against raging inflation, meaning the real purchasing-power loss far exceeded what the nominal figures suggest. The 7.5-year nominal break-even also compares unfavorably to the roughly 5-year recovery after 2009.
Why did inflation make the 1973–74 S&P 500 crash especially damaging for investors?
Inflation running at 8–12% annually during the recovery years meant that each dollar the S&P 500 returned was worth less in real terms. An investor who broke even nominally in July 1980 had actually lost substantial purchasing power because the $10,000 recovered in 1980 could buy far fewer goods and services than $10,000 in 1973. This inflation dimension made the 1973–74 bear market uniquely destructive to wealth in ways that purely nominal return figures conceal.
What lessons from the 1973–74 S&P 500 oil crisis crash apply to investors today?
Several lessons remain highly relevant. First, energy price shocks can trigger rapid, deep equity bear markets even when underlying corporate fundamentals appear sound. Second, inflation during a market recovery can silently destroy real returns even after nominal break-even is achieved — making inflation-protected assets worth considering as a hedge. Third, DCA investors who maintained contributions through the darkest months were rewarded with a significantly earlier break-even, underscoring that consistent investing through downturns is often the optimal long-term strategy.