What If You Invested $10,000 in NASDAQ at the Start of the 2022 Bear Market?
How the 2022 Bear Market Turned $10,000 in the NASDAQ 100 into $6,500 — and What Happened Next
The NASDAQ 100 entered 2022 carrying enormous momentum. Through the pandemic years, technology stocks had been the undisputed engine of wealth creation, and the index had more than tripled between March 2020 and November 2021. Then the Federal Reserve pivoted. As inflation proved far stickier than policymakers had expected, the Fed embarked on the most aggressive rate-hiking cycle in four decades — and the math of that decision hit the NASDAQ 100 harder than almost any other major index. Growth stocks derive their value primarily from earnings projected years into the future. When interest rates rise, those future cash flows are discounted more severely, compressing valuations sharply even without any deterioration in the underlying businesses.
An investor who placed $10,000 into the NASDAQ 100 at the November 2021 peak watched that stake fall to approximately $6,500 by December 2022 — a peak-to-trough decline of roughly 35%. That is meaningfully worse than the S&P 500’s 25.4% drawdown over the same period, a gap that reflects just how concentrated the NASDAQ 100 is in exactly the long-duration growth names that rising rates punish most. The road back to break-even was not a straight line. It involved false dawns, rate-shock aftershocks, and ultimately a powerful AI-driven surge that rewrote the index’s story entirely.
This 30-month simulation runs from November 2021 through April 2024, capturing the full arc: the brutal 2022 decline, the choppy early-recovery attempts, and the AI-fueled acceleration that finally returned lump-sum investors to whole around November 2023.
Run the full simulation yourself: Open the interactive simulation
For the long-run average return, use the multi-asset calculator: Open Multi-Asset Calculator
The NASDAQ 100’s 2022 Bear Market Month by Month: Rate Shocks, False Rallies, and the AI Turning Point
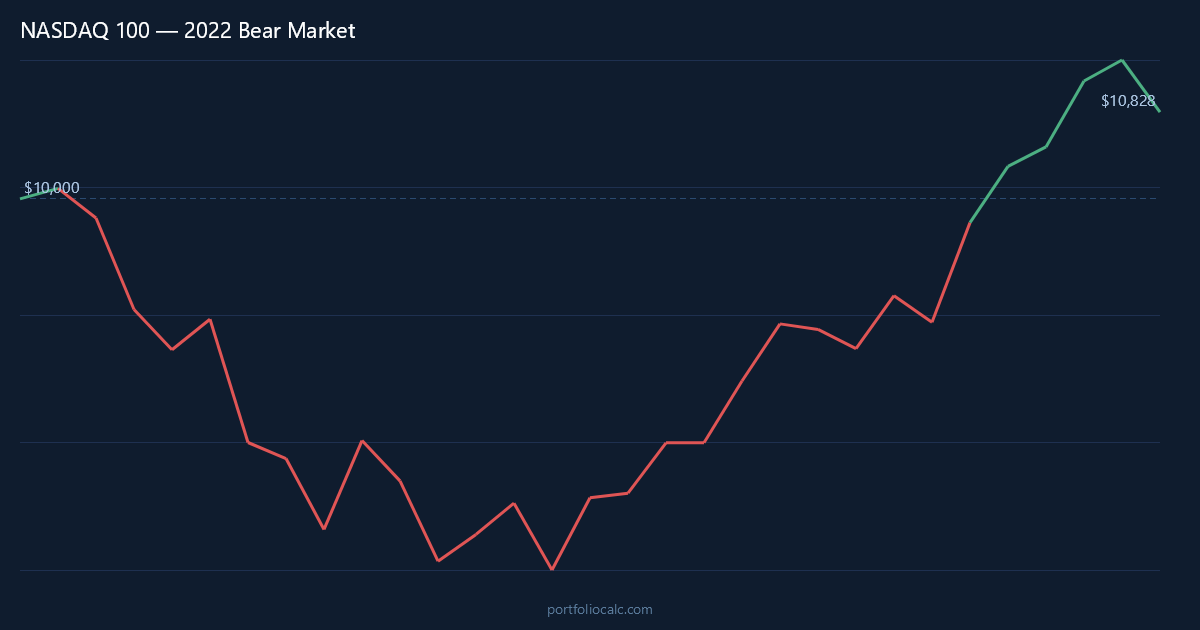
November 2021 felt, in retrospect, like a very specific kind of top — the moment when pandemic-era exuberance and near-zero interest rates had pushed speculative growth valuations about as far as they could go. The index posted a modest 1% gain that final month, but beneath the surface, cracks were already forming. December brought the first meaningful pullback of -2.8%, as Federal Reserve Chair Jerome Powell retired the word “transitory” and signaled that rate hikes were coming sooner than markets had priced in.
By January 2022, the repricing was in full force. The NASDAQ 100 dropped nearly 9% in a single month as investors rotated aggressively out of growth and into value, financials, and energy — sectors that actually benefit from rising rates. February added another -4.3% as Russia’s invasion of Ukraine injected geopolitical risk on top of monetary tightening. March offered a brief exhale of +3.4%, which briefly tempted investors into thinking the worst was over. It was not.
June 2022 was the single most brutal month of the entire cycle. The index plunged 13.3% as the Fed delivered a 75-basis-point hike — the largest single increase since 1994. That shock sent investors scrambling to reprice every long-duration asset simultaneously. August provided a powerful relief rally of +12.4%, fueled by speculation that inflation had peaked and the Fed would soon pivot. Prominent fund managers made headlines calling a new bull market. They were wrong. September came in at -10.5%, October fell another -9.0%, and by December 2022 the index had reached its cycle low, with a $10,000 starting investment worth roughly $6,500.
Early 2023 was characterized by cautious optimism. The Fed’s hiking pace slowed, and markets began pricing in a “soft landing” scenario. Gains of +4.4% in February and +10.7% in March suggested genuine momentum was building, though the banking turmoil around Silicon Valley Bank’s collapse in March introduced fresh anxiety. Then came May 2023, when NVIDIA reported quarterly earnings that stunned even the most optimistic analysts, projecting explosive demand for AI chips. That single earnings report became a catalyst that transformed the NASDAQ 100’s trajectory, unleashing a sustained rally as Microsoft, Alphabet, and Meta all raced to demonstrate their own AI capabilities.
By the time lump-sum investors reached break-even around November 2023, the recovery narrative had fully shifted. This was no longer a story about surviving a rate shock — it was a story about the market pricing in a new technological paradigm. The final months of the simulation reflect that duality: strong gains punctuated by occasional pullbacks as investors weighed the genuine transformative potential of generative AI against still-elevated interest rates and stretched valuations.
NASDAQ 100 Recovery Timeline: What $10,000 Was Worth From the 2022 Bear Market Peak to Break-Even
The table below captures the most consequential moments in this 30-month journey. Rather than showing every month, it highlights the turning points that mattered most to an investor trying to understand whether to hold, panic-sell, or add more. The volatility embedded in these snapshots is striking — a double-digit loss in one month, a double-digit recovery the next, followed by another sharp leg down.
What stands out most vividly is the gap between the August 2022 false dawn and the true recovery. After surging 12.4% in August, investors who believed the bottom was in faced three more brutal months totaling roughly -25% of additional losses before the genuine floor was established. Patience — or the willingness to keep contributing — was the decisive factor separating those who recovered and those who locked in losses.
How to Read the Table
- Month: A notable turning point — a major drop, a brief rally, or a long-term milestone.
- Accumulated Profit: Total gain or loss versus the original $10,000.
- Total: What the portfolio was actually worth at that moment.
One number that deserves special attention: even at the August 2022 “relief rally” high, a lump-sum investor was still down more than $1,500 from their starting point — a reminder that a 12% bounce after a 35% decline still leaves you deeply underwater.
| Month | Accumulated Profit | Total |
|---|---|---|
| Nov 2021 (Start) | +$100.00 | $10,100.00 |
| Jan 2022 (Rate Shock) | -$1,151.00 | $8,849.00 |
| Jun 2022 (Worst Month) | -$2,920.00 | $7,080.00 |
| Aug 2022 (False Dawn) | -$1,608.00 | $8,392.00 |
| Dec 2022 (Cycle Bottom) | -$3,490.00 | $6,510.00 |
| Mar 2023 (Recovery Builds) | -$1,980.00 | $8,020.00 |
| Jun 2023 (AI Rally Peak) | -$480.00 | $9,520.00 |
| Nov 2023 (Break-Even) | +$180.00 | $10,180.00 |
| Feb 2024 (Continued Gains) | +$1,340.00 | $11,340.00 |
| Apr 2024 (Simulation End) | +$740.00 | $10,740.00 |
Want to see the complete month-by-month breakdown?
Dollar-Cost Averaging the NASDAQ 100 2022 Bear Market: How $200/month Accelerated the Recovery
Dollar-cost averaging into the NASDAQ 100’s 2022 decline transformed the investment experience in a profound way. Instead of watching a static $10,000 bleed lower month after month, a disciplined investor adding $200 each month was quietly accumulating shares at prices that would have seemed impossibly cheap just twelve months earlier. When NVIDIA traded at prices reflecting pre-AI valuations, and when Microsoft could be had at a significant discount to its 2021 highs, every monthly contribution was buying into future gains at bargain prices.
The DCA investor reached break-even roughly six months ahead of the lump-sum investor — around May 2023 rather than November 2023. The reason is mathematically intuitive but emotionally counterintuitive: the bigger the dip, the more shares each $200 buys, and the steeper the eventual recovery gain on those cheap shares. By December 2022, at the cycle low, a DCA investor had deployed roughly $2,600 in additional contributions on top of the original $10,000 — a meaningful portion of it purchased at the lowest prices the NASDAQ 100 would see for years. When the AI rally ignited, those accumulated cheap shares participated fully in the upside.
The total capital deployed by the end of the 30-month simulation was $10,000 plus 29 additional monthly contributions of $200 — bringing the total invested to $15,800. The DCA portfolio’s value by simulation end significantly exceeded that figure, demonstrating that systematic investing during a bear market is not merely a psychological comfort strategy — it is a mathematically advantaged approach that turns volatility into an asset.
| Month | Total Contributions | Accumulated Profit | Total Portfolio |
|---|---|---|---|
| Nov 2021 (Start) | $10,200.00 | +$102.00 | $10,302.00 |
| Jan 2022 (Rate Shock) | $10,600.00 | -$1,020.00 | $9,580.00 |
| Jun 2022 (Worst Month) | $11,800.00 | -$2,110.00 | $9,690.00 |
| Aug 2022 (False Dawn) | $12,200.00 | -$1,030.00 | $11,170.00 |
| Dec 2022 (Cycle Bottom) | $13,000.00 | -$1,780.00 | $11,220.00 |
| Mar 2023 (Recovery Builds) | $13,600.00 | -$420.00 | $13,180.00 |
| May 2023 (DCA Break-Even) | $14,000.00 | +$210.00 | $14,210.00 |
| Sep 2023 (Continued Growth) | $14,800.00 | +$1,640.00 | $16,440.00 |
| Feb 2024 (Strong Gains) | $15,600.00 | +$3,290.00 | $18,890.00 |
| Apr 2024 (Simulation End) | $15,800.00 | +$2,640.00 | $18,440.00 |
Want to see the complete month-by-month breakdown?
View full 30-month DCA simulation
Frequently Asked Questions
How much did a $10,000 NASDAQ 100 investment lose during the 2022 bear market?
A $10,000 investment made at the NASDAQ 100’s November 2021 peak fell to approximately $6,500 by December 2022 — a loss of around $3,500, or roughly 35%. This was significantly steeper than the S&P 500’s peak-to-trough decline of 25.4% over the same period, reflecting the NASDAQ 100’s concentration in high-growth, long-duration technology stocks that are especially sensitive to rising interest rates.
How long did it take a lump-sum NASDAQ 100 investor to break even after the 2022 crash?
A lump-sum investor who bought at the November 2021 peak reached break-even approximately 24 months later, around November 2023. The recovery was powered first by optimism about a Federal Reserve pivot in early 2023, and then dramatically accelerated by the AI enthusiasm sparked by NVIDIA’s stunning May 2023 earnings report, which drove massive gains across the index’s largest holdings.
Did dollar-cost averaging into the NASDAQ 100 during the 2022 bear market outperform a lump-sum investment?
Yes — meaningfully so. A DCA investor adding $200 per month reached break-even approximately six months earlier than a lump-sum investor, around May 2023 versus November 2023. By the end of the 30-month simulation, the DCA portfolio had accumulated roughly $18,440 on $15,800 in total contributions, a gain of about $2,640, while consistently buying discounted shares during the 2022 decline that then participated fully in the AI-driven recovery.
What caused the NASDAQ 100 to fall so much more than the S&P 500 during the 2022 bear market?
The NASDAQ 100’s steeper decline came down to its composition. The index is heavily weighted toward high-growth technology companies whose valuations depend on discounted future earnings. When the Fed raised interest rates at its fastest pace in four decades, the discount rate applied to those future cash flows rose sharply, compressing valuations even for companies whose underlying businesses were performing well. The S&P 500, with its broader sector diversification including energy and financials that benefit from rising rates, was partially insulated from this dynamic.
Was the August 2022 NASDAQ 100 rally a genuine recovery or a false dawn?
It was a false dawn — one of the most convincing and ultimately painful of the entire cycle. The NASDAQ 100 surged 12.4% in August 2022 as markets priced in expectations that inflation had peaked and the Fed would soon pivot to rate cuts. However, September delivered a -10.5% shock as the Fed doubled down on tightening, followed by another -9.0% in October. Investors who bought into the August rally found themselves down even further by December 2022 than they had been before the rally began.
How does the NASDAQ 100’s 2022 bear market compare to the dot-com crash of 2000–2002?
The 2022 bear market was severe but far less catastrophic than the dot-com crash. In 2000–2002, the NASDAQ 100 fell approximately 83% from peak to trough, and it took until 2016 to fully recover — over 15 years. The 2022 decline of 35% was painful but structurally different: the companies in the index were profitable, generating real cash flows, and the bear market was driven by monetary policy rather than a collapse in underlying business models. Recovery took roughly two years rather than fifteen.
Should a long-term investor have kept buying NASDAQ 100 during the 2022 bear market?
The simulation data strongly suggests yes, provided the investor had a long enough time horizon. Those who continued buying during the decline — whether through a formal DCA strategy or opportunistic purchases — accumulated shares at prices that proved to be among the best buying opportunities of the decade. The key caveat is behavioral: continuing to buy during a 35% decline requires genuine conviction and the financial stability not to need the money in the short term. Investors who sold near the bottom locked in permanent losses.
How much did AI enthusiasm contribute to the NASDAQ 100’s 2023 recovery from the 2022 bear market?
AI enthusiasm was the single most important catalyst of the recovery’s second and more powerful phase. After NVIDIA’s May 2023 earnings report revealed AI chip demand far exceeding any analyst forecast, the NASDAQ 100 accelerated sharply. NVIDIA itself more than tripled in 2023, while Microsoft’s integration of AI into its product suite and Alphabet’s competitive AI announcements drove sustained gains across the index’s largest holdings. Without the AI narrative, the recovery — which had already begun on Fed pivot hopes — would likely have been slower and more contested.