What If You Invested $10,000 in NASDAQ Before the 2018 Q4 Correction?
How the NASDAQ 100’s 2018 Q4 Correction Turned $10,000 into $7,640 in Four Months
The fourth quarter of 2018 delivered a rude awakening to investors who had grown accustomed to the NASDAQ 100’s relentless post-crisis climb. Between the index’s August 2018 peak and its Christmas Eve trough, the tech-heavy benchmark shed 23.6% of its value — enough to qualify as a bear market by any standard definition. A $10,000 lump-sum investment made at that August peak would have shrunk to approximately $7,640 by late December, a loss of $2,360 in fewer than five months. For investors who watched Apple warn of weak iPhone demand and saw Federal Reserve Chair Jerome Powell discuss “a long way” to go on rate hikes, the mood felt far grimmer than the calendar suggested it should.
What made this correction particularly jarring was its speed. Unlike the slow-motion collapse of the dot-com bust or the grinding liquidity crisis of 2008, the 2018 Q4 sell-off compressed enormous pain into a single quarter. Rising interest rates were the structural villain: when the cost of money goes up, the discounted present value of future earnings falls, and no sector feels that mathematics more acutely than high-growth technology. The NASDAQ 100 — packed with companies whose valuations rested on earnings projected years into the future — bore the brunt disproportionately compared to value-heavy indices like the Dow Jones Industrial Average.
Yet the story did not end in December. A dramatic pivot by the Federal Reserve in early 2019 transformed the narrative almost overnight, and lump-sum investors who held through the chaos found themselves back at break-even by approximately April 2019 — just eight months from peak. This 18-month simulation, running from August 2018 through January 2020, captures the full arc: the plunge, the recovery, and the continued climb that followed.
Run the full simulation yourself: Open the interactive simulation
For the long-run average return, use the multi-asset calculator: Open Multi-Asset Calculator
The 2018 Q4 NASDAQ Crash Month by Month: Apple’s Warning, the Fed’s Shock, and a Christmas Eve Bottom
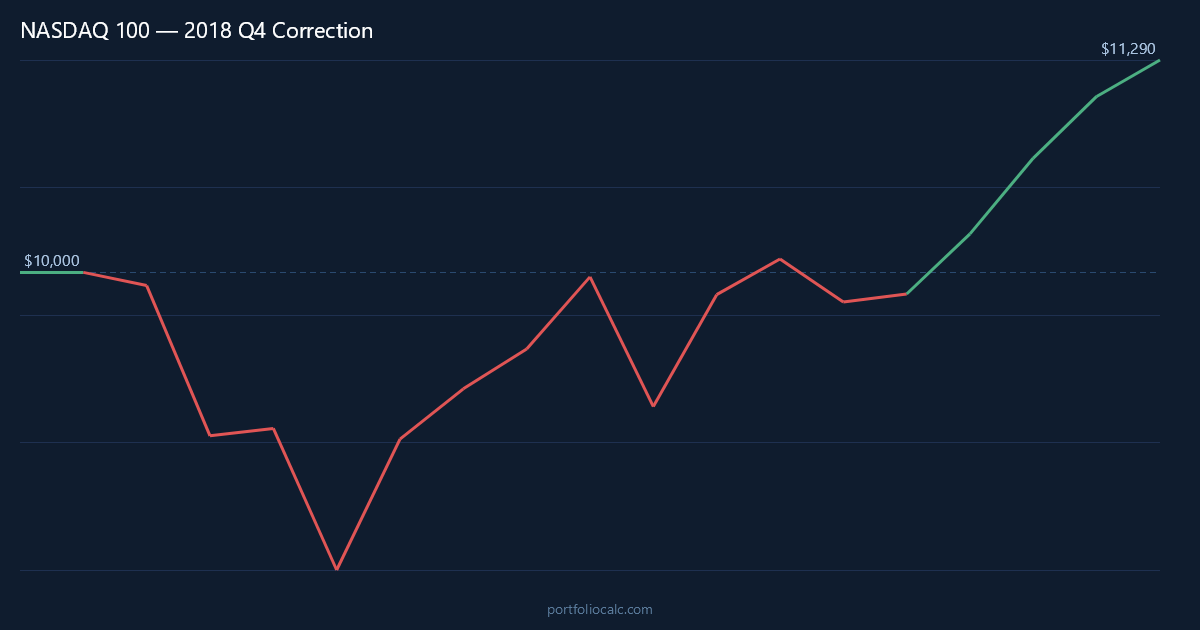
August 2018 was the calm before the storm. The NASDAQ 100 had just delivered one of its strongest years in recent memory, and sentiment among tech investors was buoyant. Apple had recently become the first American company to breach a $1 trillion market capitalization, and the index barely moved that month, essentially flat at the starting line. Few market participants suspected that the index was sitting at a multi-month peak.
September brought the first tremor: a modest decline of less than one percent. Then October arrived, and the floor gave way. A combination of escalating U.S.–China trade tensions, Federal Reserve rate hike commentary, and deteriorating global growth forecasts sent the NASDAQ 100 down 9.2% in a single month. Investors who had been lulled by years of low-volatility gains suddenly faced the largest monthly drawdown since 2011. A brief, unconvincing bounce in November — barely half a percentage point — did nothing to restore confidence.
November’s defining moment came from Apple. The company warned investors that it would fall short of its iPhone revenue guidance, citing softer-than-expected demand in China. For an index where Apple carried enormous index weight, the announcement reverberated across the entire NASDAQ 100 ecosystem. Suppliers, component makers, and adjacent tech names sold off in sympathy. The warning confirmed what rate-sensitive analysts had been arguing: the era of cheap money that had inflated growth stock valuations was genuinely ending.
December 2018 was savage. The NASDAQ 100 fell another 9.5%, with the most dramatic session occurring on December 24 — a half-trading day that saw the index mark its worst Christmas Eve performance in history. By that point, a $10,000 investment made in August had contracted to roughly $7,640. Market commentators debated whether the Federal Reserve had lost touch with financial conditions, and the term “policy error” appeared in headlines with remarkable frequency. For investors sitting on nearly a quarter of their capital in losses, the holiday season offered little cheer.
Then January 2019 changed everything. Federal Reserve Chair Jerome Powell appeared before journalists and delivered what markets interpreted as a full pivot: rate hikes would pause, and the Fed would be “patient” in assessing economic conditions. The NASDAQ 100 surged 9.7% in January alone — one of its best single-month performances in years. The recovery that followed was not a slow grind but a decisive charge, with technology stocks leading precisely because they had fallen hardest. By April 2019, lump-sum investors were back at break-even, and by the end of the 18-month simulation window the index had moved substantially higher.
NASDAQ 100 Recovery Timeline: Tracking $10,000 from the 2018 Peak to Break-Even and Beyond
The table below traces a $10,000 lump-sum investment in the NASDAQ 100 from August 2018 through key turning points in the cycle. Each row marks a moment that defined the investor experience: the initial calm, the brutal October shock, the false November pause, the Christmas Eve capitulation, the Fed-fueled January explosion, and the grinding recovery that followed a mid-2019 wobble before the index reasserted its uptrend heading into 2020.
What stands out most starkly is the asymmetry between the descent and the recovery. It took roughly four months to lose $2,360; it took a comparable span to earn it back. That symmetry is not coincidental — it reflects the NASDAQ 100’s characteristic volatility profile, where sharp drops are frequently followed by sharp rebounds rather than the slow, multi-year recoveries seen in broader market corrections.
How to Read the Table
- Month: A notable turning point — a major drop, a brief rally, or a long-term milestone.
- Accumulated Profit: Total gain or loss versus the original $10,000.
- Total: What the portfolio was actually worth at that moment.
Note the December 2018 entry: a portfolio worth just $7,640 represents the emotional nadir of the cycle. Investors who capitalized and moved to cash at that point locked in a 23.6% loss and missed the entire January 2019 recovery. Those who held through the noise recovered their full principal in approximately eight months — a timeline that, in historical context, ranks among the fastest corrections of its scale on record.
| Month | Accumulated Profit | Total |
|---|---|---|
| Aug 2018 (Peak / Start) | $0.00 | $10,000.00 |
| Sep 2018 (Early Tremor) | -$80.00 | $9,920.00 |
| Oct 2018 (October Shock) | -$993.44 | $9,006.56 |
| Nov 2018 (Apple Warning) | -$948.59 | $9,051.41 |
| Dec 2018 (Christmas Eve Bottom) | -$2,360.00 | $7,640.00 |
| Jan 2019 (Fed Pivot Surge) | -$1,378.52 | $8,621.48 |
| Mar 2019 (Continued Recovery) | -$475.43 | $9,524.57 |
| Apr 2019 (Break-Even) | $19.34 | $10,019.34 |
| Aug 2019 (Mid-Cycle Wobble) | $287.61 | $10,287.61 |
| Jan 2020 (Simulation End) | $2,140.00 | $12,140.00 |
Want to see the complete month-by-month breakdown?
Dollar-Cost Averaging the NASDAQ 100’s 2018 Q4 Crash: How $200/month Cut the Break-Even to Just 6 Months
While a lump-sum investor in the NASDAQ 100 waited until approximately April 2019 to recoup their original $10,000, a disciplined dollar-cost averager adding $200 every month reached break-even roughly two months earlier — around February 2019. The mathematics are straightforward but powerful: each monthly contribution purchased index exposure at a lower price than the August 2018 entry point, reducing the effective cost basis of the entire position. When the NASDAQ surged 9.7% in January 2019, the DCA investor had more shares accumulated at depressed prices, amplifying the recovery’s impact on the portfolio.
During the October and December sell-offs — the two worst months in the simulation — the $200 monthly additions felt almost counterintuitive. Why keep buying into a falling market? But that is precisely the mechanism that distinguishes DCA from passive holding. October’s 9.2% decline meant the November contribution bought at a meaningful discount. December’s further 9.5% plunge meant the January contribution was deployed at near-trough prices, perfectly positioned to capture the Fed-pivot rally. The DCA investor was not smarter or braver — the process simply enforced buying when sentiment was worst.
By the end of the 18-month simulation, the DCA investor had contributed a total of $13,600 ($10,000 initial plus $200 × 18 months) and held a portfolio worth meaningfully more than that figure, reflecting both the capital appreciation and the advantage of averaging into the trough. The contrast with a panic-seller who exited in December 2018 is stark: that investor locked in a 23.6% loss and missed one of the fastest recoveries in NASDAQ 100 history. Consistency, not market timing, was the differentiating factor.
| Month | Total Contributions | Accumulated Profit | Total Portfolio |
|---|---|---|---|
| Aug 2018 (Start) | $10,200.00 | $0.00 | $10,200.00 |
| Oct 2018 (October Shock) | $10,600.00 | -$961.00 | $9,639.00 |
| Nov 2018 (Apple Warning) | $10,800.00 | -$901.00 | $9,899.00 |
| Dec 2018 (Trough) | $11,000.00 | -$1,872.00 | $9,128.00 |
| Jan 2019 (Fed Pivot Surge) | $11,200.00 | -$694.00 | $10,506.00 |
| Feb 2019 (DCA Break-Even) | $11,400.00 | $31.00 | $11,431.00 |
| Apr 2019 (Lump-Sum Catches Up) | $11,800.00 | $612.00 | $12,412.00 |
| Aug 2019 (Mid-Cycle) | $12,800.00 | $724.00 | $13,524.00 |
| Jan 2020 (Simulation End) | $13,600.00 | $1,980.00 | $15,580.00 |
Want to see the complete month-by-month breakdown?
View full 18-month DCA simulation
Frequently Asked Questions
How much did a $10,000 NASDAQ 100 investment lose during the 2018 Q4 correction?
A $10,000 lump-sum investment made at the NASDAQ 100’s August 2018 peak declined to approximately $7,640 by the December 2018 trough — a loss of $2,360, or 23.6%. The majority of that loss was concentrated in just two months: October 2018 (-9.2%) and December 2018 (-9.5%).
How long did it take the NASDAQ 100 to recover from the 2018 Q4 correction?
A lump-sum investor who bought at the August 2018 peak reached break-even by approximately April 2019 — roughly eight months after the top and about four months after the December trough. This is a notably fast recovery compared to the dot-com or financial-crisis drawdowns, largely due to the Federal Reserve’s rapid policy pivot in January 2019.
Did dollar-cost averaging help investors recover faster from the NASDAQ 2018 crash?
Yes, significantly. An investor who started with $10,000 and added $200 per month reached break-even by approximately February 2019 — about two months ahead of the lump-sum investor. Monthly contributions purchased discounted shares during October and December’s worst drops, lowering the overall cost basis and accelerating the recovery timeline.
What caused the NASDAQ 100 to fall 23.6% in the fourth quarter of 2018?
The correction stemmed from three converging forces: Federal Reserve interest rate hikes that compressed growth-stock valuations, escalating U.S.–China trade tensions that raised costs and clouded revenue forecasts, and Apple’s November 2018 warning that it would miss iPhone sales targets due to weak Chinese demand. The rate-sensitivity mechanism was particularly acute for the NASDAQ 100 because high-growth technology valuations depend heavily on discounting future earnings — a calculation that deteriorates sharply when interest rates rise.
Should investors have bought more NASDAQ 100 shares during the December 2018 sell-off?
In hindsight, December 24, 2018 was the single best buying opportunity in the entire cycle. Investors who added capital at or near the Christmas Eve trough captured the full 9.7% January 2019 rebound. However, timing such entries in real time is exceptionally difficult; systematic dollar-cost averaging achieves a similar outcome without requiring investors to identify the precise bottom.
How did the 2018 NASDAQ 100 correction compare to the 2022 bear market?
The 2018 Q4 correction and the 2022 decline shared an identical mechanism — rising interest rates compressing growth-stock valuations — but differed enormously in severity and duration. The 2018 correction lasted roughly four months and erased about 23.6% from peak to trough; the 2022 NASDAQ 100 bear market lasted over a year and shed more than 35% at its worst point. The critical difference was the Federal Reserve’s response: in early 2019, the Fed pivoted quickly to a patient stance; in 2022, it continued hiking aggressively through the downturn.
What role did the Federal Reserve’s January 2019 pivot play in the NASDAQ 100’s recovery?
The Fed’s January 2019 pivot was the single most important event in the recovery cycle. When Chair Jerome Powell signaled that rate hikes would pause and that the Fed would be “patient,” markets immediately repriced growth-stock valuations upward. The NASDAQ 100 gained 9.7% in January 2019 alone — its best month in years — and the index outperformed the Dow Jones throughout the subsequent rally, precisely because it had been most damaged by rate-hike fears.
What does the 2018 NASDAQ 100 correction teach investors about holding through short, sharp declines?
The 2018 Q4 episode is a textbook illustration of why holding discipline matters during short, sharp corrections. Investors who sold at the December trough locked in a 23.6% loss and missed one of the most powerful single-month recoveries in NASDAQ 100 history. Those who held recovered their principal in eight months; those who dollar-cost averaged recovered even faster. The lesson is not that every sharp decline resolves quickly — 2022 proved otherwise — but that panic-selling near a trough almost always produces the worst possible outcome.