MSCI World COVID Crash Recovery: How Long Did It Take?
The MSCI World Index declined by roughly 34% from peak to bottom during the 2020 COVID crash based on daily market data. In the weekly simulation below, the lowest displayed portfolio value is approximately $6,873, because the table uses weekly return intervals rather than daily closing values.
The calculator below applies each weekly MSCI World return from the February 2020 peak through the recovery period. It starts with a $10,000 lump-sum investment and shows how the portfolio changed each week until it moved back above the original investment value.
The simulation highlights how quickly the 2020 crash unfolded. Most of the damage occurred within a few weeks in March, while the recovery began almost immediately after the late-March bottom.
Here is a multi-asset calculator for historical average return for MSCI (~10% long-term): Compare long-term MSCI returns with other assets
What Happened to $10,000 Invested in MSCI World Before the COVID Crash?
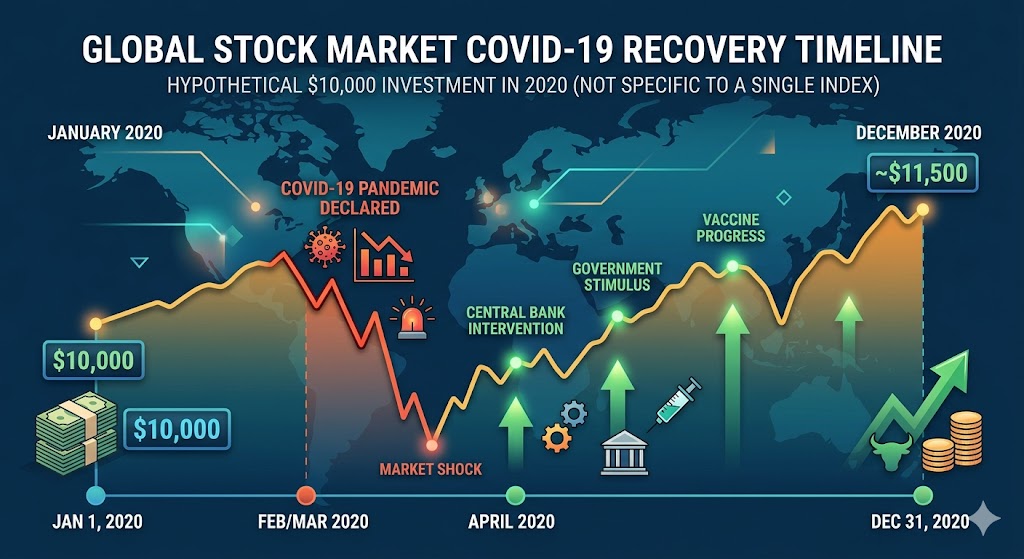
The COVID-19 crash of 2020 became one of the fastest global market selloffs in modern history. This scenario illustrates what happened to a hypothetical $10,000 investment in the MSCI World Index made near the February 2020 market peak.
As the pandemic spread across the world, international equity markets experienced extreme volatility driven by lockdowns, economic uncertainty, and fears of a global recession.
Because the MSCI World Index tracks large and mid-cap companies across developed markets, the decline reflected broad weakness across multiple sectors and countries rather than a single economy.
During the MSCI World 2020 crash drawdown, the index declined by roughly 34% from peak to bottom based on daily data. In the weekly simulation shown below, the lowest displayed portfolio value is approximately $6,873.
$10,000 MSCI World Investment at the 2020 Market Peak
- Initial investment: $10,000
- Entry point: February 2020 market peak
- Asset: MSCI World Index
- Return type: Total return, including reinvested dividends
- Contribution: None, lump-sum only
- Lowest weekly value: Approximately $6,873
- Worst weekly return: -13.5%
- Break-even point: Around early August 2020
- Recovery time: Approximately 24 weeks
This simulation follows the investment week by week through the full market decline and subsequent recovery period. Each interval applies actual historical weekly returns, allowing a detailed view of how losses developed and how the portfolio gradually recovered over time.
The actual daily peak-to-bottom decline was deeper than the weekly table suggests, but this article focuses on weekly total return intervals to show the recovery path in a simple, readable format.
Weekly data is especially important in this scenario because both the decline and recovery unfolded rapidly. Using monthly or yearly averages would hide much of the volatility and timing that defined the COVID-19 market recovery.
MSCI World Recovery Timeline: Week-by-Week After the 2020 Crash
The table illustrates how a hypothetical $10,000 investment evolved during the 2020 COVID-19 market crash and subsequent recovery. The decline began immediately in late February, with the portfolio dropping from $10,000 to $8,860 after only two weeks as panic selling accelerated across global markets.
The most severe losses occurred between 9 March and 22 March 2020. During this period, the investment fell from $8,958 to just $6,873, representing the deepest drawdown of the recovery timeline. The single worst week was 16 Mar - 22 Mar, when the portfolio declined by another 13.5%.
A major turning point appeared during the week of 23 Mar - 29 Mar 2020, when the portfolio gained 10.1% in a single week. This marked the beginning of a sustained recovery supported by improving market sentiment and large-scale economic stimulus measures.
Although several smaller pullbacks occurred later, the recovery remained steady throughout spring and summer. By 27 Jul - 02 Aug 2020, the portfolio fully recovered and exceeded the original investment value, reaching $10,129.
| Week | Start Amount | Rate % | Accumulated Profit | Total |
|---|---|---|---|---|
| 17 Feb - 23 Feb 2020 | 10,000.00 | -2.2 | -220.00 | 9,780.00 |
| 24 Feb - 01 Mar 2020 | 9,780.00 | -9.4 | -1,139.32 | 8,860.68 |
| 02 Mar - 08 Mar 2020 | 8,860.68 | 1.1 | -1,041.85 | 8,958.15 |
| 09 Mar - 15 Mar 2020 | 8,958.15 | -11.3 | -2,054.12 | 7,945.88 |
| 16 Mar - 22 Mar 2020 | 7,945.88 | -13.5 | -3,126.82 | 6,873.18 |
| 23 Mar - 29 Mar 2020 | 6,873.18 | 10.1 | -2,432.63 | 7,567.37 |
| 30 Mar - 05 Apr 2020 | 7,567.37 | 2.6 | -2,235.87 | 7,764.13 |
| 06 Apr - 12 Apr 2020 | 7,764.13 | 6.5 | -1,731.21 | 8,268.79 |
| 13 Apr - 19 Apr 2020 | 8,268.79 | 2.3 | -1,541.02 | 8,458.98 |
| 20 Apr - 26 Apr 2020 | 8,458.98 | 3.8 | -1,219.58 | 8,780.42 |
| 25 May - 31 May 2020 | 9,139.10 | 3.7 | -522.75 | 9,477.25 |
| 20 Jul - 26 Jul 2020 | 9,882.84 | -0.2 | -136.92 | 9,863.08 |
| 27 Jul - 02 Aug 2020 | 9,863.08 | 2.7 | 129.38 | 10,129.38 |
Want to explore the full week-by-week breakdown?
Open the full MSCI World recovery calculator →What If You Invested $50 Weekly During the MSCI World COVID Crash?
This simulation demonstrates how small but consistent weekly contributions accelerated the portfolio recovery after the 2020 COVID-19 market crash. Although the investment initially declined sharply, reaching a low near $7,063 on weekly level (on daily even lower) during March 2020, the additional $50 weekly contributions continuously added capital while prices remained depressed.
These contributions allowed more shares to be accumulated during the downturn, increasing the impact of the subsequent market rebound. As recovery momentum strengthened through April and May, the portfolio value recovered faster than a lump-sum-only investment scenario. The investment exceeded the original $10,000 balance by the end of May 2020, highlighting the long-term benefit of disciplined dollar-cost averaging during periods of extreme volatility.
| Week | Start Amount | Contribution | Rate % | Accumulated Profit | Total |
|---|---|---|---|---|---|
| 17 Feb - 23 Feb 2020 | 10,000.00 | 50 | -2.2 | -221.10 | 9,828.90 |
| 16 Mar - 22 Mar 2020 | 8,115.42 | 50 | -13.5 | -3,186.91 | 7,063.09 |
| 23 Mar - 29 Mar 2020 | 7,063.09 | 50 | 10.1 | -2,468.49 | 7,831.51 |
| 25 May - 31 May 2020 | 9,895.53 | 50 | 3.7 | -436.48 | 10,313.52 |
| 01 Jun - 07 Jun 2020 | 10,313.52 | 50 | 4.0 | -73.76 | 10,726.24 |
Want to explore the full week-by-week breakdown?
View full 24-week MSCI World simulation →Key Takeaway: MSCI World Recovery After the COVID Crash
The recovery of the MSCI World Index after the COVID-19 crash highlights the resilience of globally diversified equity investing. Although international markets experienced a sharp decline during the early stages of the pandemic, developed market equities recovered steadily as economic conditions stabilized and investor confidence improved.
Diversification cannot eliminate short-term losses, but maintaining a disciplined long-term investment strategy has historically helped investors recover from major market downturns.
Investors who remained invested throughout the 2020 volatility benefited from the broad exposure provided by the MSCI World Index, which includes companies across multiple developed countries and sectors. The recovery demonstrated how diversification, patience, and long-term compounding can support portfolio growth even after severe global market shocks.
Frequently Asked Questions (FAQ)
How long did it take for the MSCI World Index to recover from the COVID-19 crash?
The MSCI World Index recovered to break-even approximately 24 weeks after the February 2020 market peak, reaching recovery around early August 2020. The rebound was supported by global stimulus programs, improving investor sentiment, and economic reopening.
How much did a $10,000 investment lose during the crash?
A $10,000 investment temporarily declined to approximately $6,600 at the March 2020 low, representing a drawdown of about -34% during the most severe phase of the global market selloff.
Does this recovery include dividends?
Yes, this analysis reflects total return performance, meaning dividends are reinvested throughout the recovery period. This provides a more accurate representation of long-term investor returns.
Why did the MSCI World Index recover relatively quickly after the crash?
The MSCI World Index benefited from broad diversification across developed economies and sectors. Strong performance from technology and healthcare companies, combined with aggressive monetary and fiscal stimulus, contributed to the recovery.