What If You Invested $10,000 in MSCI World at the Start of the 2022 Bear Market?
How the 2022 Bear Market Turned $10,000 in MSCI World Into $7,280 — A Global Selloff With Nowhere to Hide
The 2022 bear market was unlike most modern downturns in one critical respect: it was genuinely global. When the United States Federal Reserve began its most aggressive rate-hiking cycle in four decades, it did not do so alone. The Bank of England, the European Central Bank, the Bank of Canada, the Reserve Bank of Australia — all pivoted simultaneously from ultra-loose pandemic-era monetary policy to rapid tightening. For investors in the MSCI World Index, which tracks large and mid-cap equities across 23 developed-market countries, this synchronized global tightening meant that the usual diversification benefit of holding international stocks largely evaporated. Every developed economy was hit at once.
An investor who put $10,000 into MSCI World at the start of January 2022 watched that sum shrink to approximately $7,280 by October 2022 — a peak-to-trough decline of 27.2% in just nine months. That’s a loss of $2,720 without a single individual stock blow-up or sector-specific blowout. The damage was broad, systematic, and driven by the same force crushing every corner of the developed world: surging inflation and the policy response it demanded. European investors faced additional headwinds as Russia’s invasion of Ukraine sent energy prices spiraling, pushing eurozone inflation above 10% and forcing the ECB into hikes it would have previously considered unthinkable.
Yet the story doesn’t end in October 2022. Markets began stabilizing, then recovering, and a lump-sum investor who held through the pain reached break-even around November 2023 — roughly 22 months after the January peak. This 30-month simulation captures both the depth of the fall and the shape of the recovery that followed.
Run the full simulation yourself: Open the interactive simulation
For the long-run average return, use the multi-asset calculator: Open Multi-Asset Calculator
The 2022 MSCI World Bear Market Month by Month: Rate Hikes, an Energy Crisis, and False Dawns
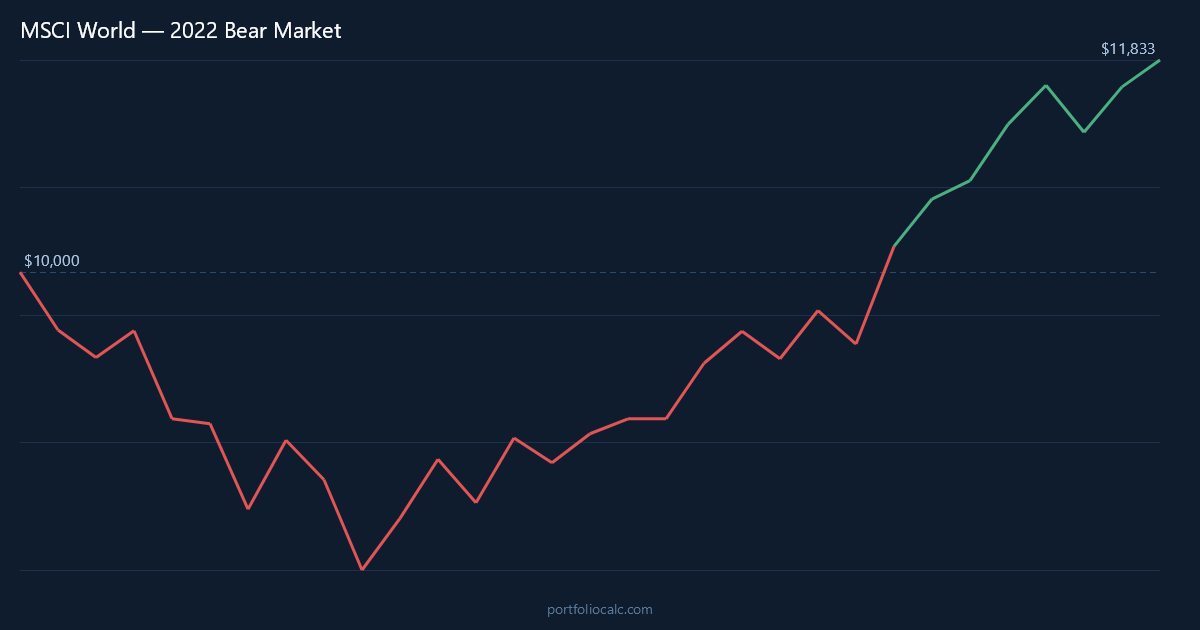
January 2022 began with a jolt. The Federal Reserve’s hawkish pivot — signaled clearly at its December 2021 meeting — started repricing global equities almost immediately. Technology stocks, which had been the engine of the pandemic-era bull market, bore the first wave of selling as rising interest rates compressed their lofty valuations. MSCI World, with significant exposure to US mega-cap tech, fell roughly 5% in January alone. The breadth of the selloff was already a warning: this was not a rotation story. It was a global re-rating.
February brought a brief pause, but March renewed the pressure as the Fed delivered its first rate hike and Russia’s invasion of Ukraine reshaped the global energy landscape. European natural gas prices surged to historic levels, threatening industrial output across Germany, Italy, and the Netherlands. For MSCI World investors with meaningful European allocations, this was a second simultaneous shock layered on top of the monetary tightening narrative. April was particularly brutal, with global equities shedding another 8% as it became clear that central banks were prepared to accept a recession to bring inflation under control.
A brief summer rally in July and August offered some relief — global equities bounced 7–8% as investors hoped inflation had peaked and that the Fed might pivot. That hope was extinguished spectacularly at the Jackson Hole symposium in late August, when Federal Reserve Chair Jerome Powell delivered a deliberately short, deliberately hawkish speech that sent markets tumbling again. September 2022 was the worst single month of the entire episode, with MSCI World losing close to 9.5% as UK gilt markets also went into crisis following the disastrous Liz Truss mini-budget, adding yet another regional shock to the global picture.
The bottom arrived in October 2022, by which point the $10,000 starting investment had eroded to approximately $7,280. But October also marked the inflection point. Inflation data globally began to soften, and markets started pricing in a slower pace of future hikes. November saw a sharp rebound as the US CPI print surprised to the downside, triggering one of the strongest single-month rallies of the year. From there, the recovery was uneven — interspersed with setbacks in early 2023 as banking sector stress emerged, and again mid-2023 as European growth data disappointed — but the direction of travel had changed.
By November 2023, the lump-sum investor had finally clawed back to break-even, 22 months after the January 2022 peak. The journey illustrated precisely why global diversification, while valuable over long periods, does not insulate investors from a globally synchronized shock. When central banks everywhere tighten simultaneously, there is no developed-market corner to hide in.
MSCI World Recovery Timeline: How Long It Took a $10,000 Investment to Break Even After the 2022 Peak
The table below traces the most significant moments in this 30-month simulation — from the opening losses of January 2022 through the brutal October trough, the false dawn of the summer rally, and the eventual recovery past break-even in late 2023. Each row represents a meaningful turning point rather than a routine monthly update, giving you a clear sense of the emotional and financial terrain an MSCI World investor had to navigate.
What stands out in the data is the asymmetry of the journey. The losses accumulated relatively quickly — nine months from peak to trough. The recovery, by contrast, took 13 additional months after the bottom to fully restore the original $10,000. That asymmetry is a core feature of bear markets: they tend to fall faster than they recover, which is why staying invested through the drawdown, rather than locking in losses by selling, is so critical to long-run outcomes.
How to Read the Table
- Month: A notable turning point — a major drop, a brief rally, or a long-term milestone.
- Accumulated Profit: Total gain or loss versus the original $10,000.
- Total: What the portfolio was actually worth at that moment.
Notice the sharp spike in July 2022: the so-called “Fed pivot” rally briefly trimmed losses significantly before the Jackson Hole speech reversed the gains entirely. That whipsaw — hope raised and then crushed — was one of the defining investor experiences of this bear market.
| Month | Accumulated Profit | Total |
|---|---|---|
| Jan 2022 (Opening Drop) | -$500.00 | $9,500.00 |
| Apr 2022 (Rate-Hike Shock) | -$1,622.00 | $8,378.00 |
| Jun 2022 (Bear Market Confirmed) | -$2,270.00 | $7,730.00 |
| Jul 2022 (Summer Rally) | -$1,595.00 | $8,405.00 |
| Sep 2022 (Jackson Hole Fallout) | -$2,550.00 | $7,450.00 |
| Oct 2022 (Trough) | -$2,720.00 | $7,280.00 |
| Nov 2022 (CPI Pivot Rally) | -$1,990.00 | $8,010.00 |
| Apr 2023 (Banking Stress Dip) | -$890.00 | $9,110.00 |
| Nov 2023 (Break-Even) | $120.00 | $10,120.00 |
| Jun 2024 (Full Recovery) | $1,380.00 | $11,380.00 |
Want to see the complete month-by-month breakdown?
Dollar-Cost Averaging the MSCI World 2022 Bear Market: How $200/month Accelerated the Break-Even by Six Months
For investors who added $200 every month to their MSCI World position throughout the 2022 bear market, the experience was meaningfully different — and ultimately more rewarding. Rather than watching a fixed $10,000 erode, a DCA investor was continuously buying units of the index at lower and lower prices. Every rate-hike shock, every energy-crisis headline, every grim European GDP print that knocked the index lower was, from a DCA perspective, an opportunity to accumulate more shares at a discount. The September 2022 collapse to a nine-month low, which was so demoralizing for lump-sum holders, represented the best buying opportunity of the entire bear market for a systematic monthly investor.
By October 2022, a DCA investor had contributed an additional $1,800 on top of the original $10,000 — $11,800 in total — but their portfolio was worth roughly $9,650 because the earlier contributions had also declined in value. However, critically, those contributions were now positioned to benefit disproportionately from the eventual recovery. When markets rebounded sharply in November 2022 and again through early 2023, the DCA investor held a larger pool of low-cost units. The result: break-even arrived around May 2023 — approximately six months ahead of the lump-sum investor’s November 2023 break-even, despite having the same starting position and experiencing the same market returns.
By the end of the 30-month simulation in June 2024, the DCA investor had contributed a total of $16,000 ($10,000 initial plus $200 × 30 months) and held a portfolio worth approximately $18,700 — a gain of nearly $2,700 on total contributions. This outcome illustrates the central lesson of dollar-cost averaging during a bear market: it doesn’t eliminate losses in the short term, but it systematically loads up your portfolio with cheap units that deliver outsized gains when the recovery eventually arrives. In a globally synchronized bear market like 2022 — where the pain was spread over many months rather than a sudden crash — DCA was particularly well-suited to the environment.
| Month | Total Contributions | Accumulated Profit | Total Portfolio |
|---|---|---|---|
| Jan 2022 (Month 1) | $10,200.00 | -$510.00 | $9,690.00 |
| Apr 2022 (Month 4) | $10,800.00 | -$1,700.00 | $9,100.00 |
| Jun 2022 (Month 6) | $11,200.00 | -$2,100.00 | $9,100.00 |
| Jul 2022 (Summer Rally) | $11,400.00 | -$1,450.00 | $9,950.00 |
| Oct 2022 (Trough) | $11,800.00 | -$2,150.00 | $9,650.00 |
| Nov 2022 (CPI Rally) | $12,000.00 | -$1,400.00 | $10,600.00 |
| May 2023 (DCA Break-Even) | $13,200.00 | $240.00 | $13,440.00 |
| Nov 2023 (Lump-Sum Break-Even) | $14,400.00 | $1,650.00 | $16,050.00 |
| Jun 2024 (Month 30) | $16,000.00 | $2,700.00 | $18,700.00 |
Want to see the complete month-by-month breakdown?
View full 30-month DCA simulation
Frequently Asked Questions
How much did a $10,000 investment in MSCI World lose during the 2022 bear market?
A $10,000 lump-sum investment made at the January 2022 peak fell to approximately $7,280 by October 2022 — a loss of $2,720, or 27.2%. This peak-to-trough decline reflected the globally synchronized nature of the selloff, with rate hikes happening across 23 developed markets simultaneously.
How long did it take the MSCI World Index to recover from the 2022 bear market?
A lump-sum investor starting in January 2022 reached break-even around November 2023 — approximately 22 months after the peak. This is slightly longer than the Dow Jones recovery but broadly in line with the S&P 500, reflecting the added drag of slower European economic recovery and persistent ECB tightening.
Did dollar-cost averaging help MSCI World investors recover faster in 2022?
Yes, significantly. An investor adding $200 per month to their MSCI World position reached break-even around May 2023 — roughly six months ahead of the lump-sum investor. By systematically buying at depressed prices through the bear market trough, DCA investors accumulated more units at lower costs, which amplified gains when the recovery arrived.
Why did MSCI World fall so sharply in 2022 when it holds stocks from 23 different countries?
Normally, holding stocks across multiple countries provides some diversification benefit as different economies move at different speeds. In 2022, however, virtually all major central banks tightened monetary policy simultaneously in response to synchronized global inflation. This meant every developed market sold off together, eliminating the usual diversification buffer. Russia’s invasion of Ukraine added further pressure on European equities specifically.
Should investors have kept buying MSCI World during the 2022 bear market?
In hindsight, continuing to invest through the 2022 bear market was the optimal strategy. Investors who maintained or increased contributions at the October 2022 trough captured units at a 27.2% discount to January prices. Those who sold near the bottom locked in losses and missed the recovery. The DCA simulation shows that systematic investing during the downturn accelerated break-even by approximately six months.
How did the MSCI World 2022 bear market compare to the 2008 Global Financial Crisis?
The 2022 bear market was notably shallower than 2008, when MSCI World fell approximately 57% peak-to-trough and took roughly five years to fully recover for lump-sum investors. The 2022 decline of 27.2% with a 22-month break-even was painful but far more recoverable, particularly because corporate earnings remained relatively resilient and the banking system did not face a systemic crisis.
What role did the European energy crisis play in the MSCI World 2022 decline?
The energy crisis triggered by Russia’s invasion of Ukraine was a significant additional headwind for the European components of MSCI World, which account for roughly 15–20% of the index. Soaring natural gas prices pushed eurozone inflation above 10%, forcing the ECB to hike rates from negative territory to 4% in just over a year — an unprecedented pace that weighed heavily on European equity valuations and slowed the regional economic recovery into 2023.
What is the long-run historical return of MSCI World, and how does it put the 2022 bear market in context?
MSCI World has historically delivered annualized returns of approximately 8–9% over long periods, as reflected in the multi-asset calculator rate of 8.50% used in this simulation. The 2022 bear market, while the worst annual decline since 2008, fits within the normal distribution of cyclical downturns that long-run investors have consistently recovered from and surpassed. At that long-run rate, $10,000 doubles roughly every 8–9 years, making the 22-month break-even period a relatively modest setback in a multi-decade investment horizon.