What If You Invested $10,000 in MSCI World in January 2018?
How the 2018 Global Correction Turned $10,000 in MSCI World into $7,910 at the Bottom
January 2018 felt like an ideal moment to invest in global equities. Markets had just concluded a stellar 2017, volatility was historically low, and synchronized global growth seemed to be finally arriving. An investor who put $10,000 into the MSCI World Index at that peak, however, would spend the next twelve months watching their portfolio steadily erode — not in a single dramatic crash, but through a grinding, demoralizing sequence of declines punctuated by false recoveries. By December 2018, that $10,000 had shrunk to approximately $7,910, a peak-to-trough loss of 20.9% that made 2018 the worst year for global equities since the financial crisis.
What made this correction particularly brutal for international investors was how different it felt from the US experience. American investors watching the S&P 500 spent most of 2018 near all-time highs, only experiencing their sharp correction in the final quarter. MSCI World investors had no such reprieve — the index peaked in January and declined through virtually the entire calendar year. The divergence was not accidental: it reflected a fundamental split between US corporate earnings supercharged by the Trump tax cuts and international companies squeezed by trade war tariffs, a surging dollar, and region-specific political risks.
This simulation traces exactly what happened to a $10,000 lump-sum investment made at the January 2018 peak, month by month through December 2019 — a 24-month window that captures the full decline, the long recovery of 2019, and the moment lump-sum investors finally crossed back to break-even, just as the COVID crisis was about to begin.
Run the full simulation yourself: Open the interactive simulation
For the long-run average return, use the multi-asset calculator: Open Multi-Asset Calculator
The 2018 MSCI World Correction Month by Month: Trade Wars, Dollar Strength, and a Year of Slow Bleed
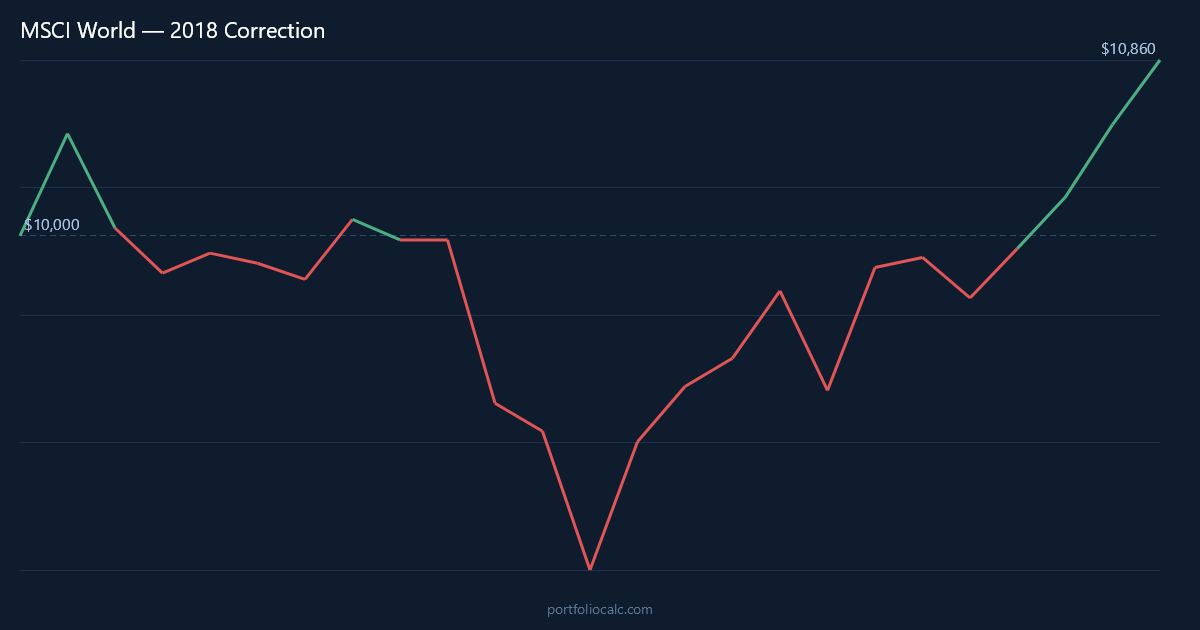
The MSCI World Index opened 2018 with a burst of optimism that briefly pushed January returns into positive territory — a final exhale of the 2017 bull run. But February delivered the first shock: a sudden spike in US bond yields and the implosion of short-volatility products triggered a global equity selloff. European and Asian markets, already more richly valued relative to earnings than many appreciated, fell sharply. For MSCI World investors, February erased nearly all of January’s gains in a matter of days.
What followed through the spring and summer was a period of frustrating sideways churn with a downward drift. US markets rebounded and pushed higher on the back of tax-cut earnings momentum, but MSCI World — with its substantial weightings in European, Japanese, and emerging-market-adjacent companies — could not replicate that performance. The Trump administration’s escalating tariff announcements in March and May directly targeted categories of goods where European and Asian manufacturers dominated: steel, aluminum, automobiles, and industrial components. Each announcement sent ripples through the international index that had no comparable domestic US offset.
The summer of 2018 brought its own category of pain that rarely gets discussed in US-centric market retrospectives. The US dollar strengthened substantially through the year, partly driven by Federal Reserve rate hikes and partly by safe-haven flows. A strong dollar is a silent tax on international equity returns for dollar-based investors, and it also created acute stress in emerging markets that had borrowed in dollars — Turkey and Argentina suffered currency crises that generated negative headlines weighing on global risk appetite throughout August and September.
Italy’s political crisis added yet another regional drag. The formation of a populist coalition government in Rome raised fears of a confrontation with the European Union over fiscal policy, sending Italian government bond yields sharply higher and weighing on European banks that held large quantities of that debt. For an index as heavily weighted toward European financial stocks as MSCI World, this was not a peripheral concern — it was a direct hit to a core sector.
Then came October and December: the two worst months of the entire correction. October saw a global synchronized selloff driven by fears that Federal Reserve tightening would overshoot and choke off growth. December was worse still, delivering a -7.5% return as recession fears combined with a US government shutdown, renewed trade-war uncertainty, and the Fed’s ill-timed rate hike to create a capitulation moment. By year-end, MSCI World had completed a devastating calendar year that left $10,000 worth only $7,910.
MSCI World 2018–2019 Recovery Timeline: $10,000 from Peak to Break-Even in 24 Months
The recovery that began in January 2019 was as swift in character as the decline had been grinding. Central banks globally pivoted toward accommodation: the Fed signaled a pause in rate hikes, the European Central Bank hinted at new stimulus, and China announced fiscal support measures. Trade-war tensions briefly de-escalated, and the relief across international equity markets was palpable. MSCI World gained 7.5% in January 2019 alone — its best monthly return in years — and continued to recover through the first half of the year.
Yet the path back to break-even for a lump-sum investor was longer than the snapback rally suggested. The index had to recover not just the December lows but the entire accumulated decline from January 2018 — a mountain that took until approximately January 2020 to fully climb. This 24-month journey from peak to break-even serves as a sobering reminder that even a correction that does not feel catastrophic in isolation can consume years of an investor’s patience when measured from the wrong starting point.
How to Read the Table
- Month: A notable turning point — a major drop, a brief rally, or a long-term milestone.
- Accumulated Profit: Total gain or loss versus the original $10,000.
- Total: What the portfolio was actually worth at that moment.
One detail that stands out from the data is just how little ground was recovered between February and September 2018. For eight months, the portfolio oscillated in a narrow band between roughly $9,300 and $9,900 — never threatening to recover, never crashing outright, simply wearing investors down with a slow and relentless drift lower before the Q4 collapse delivered the final blow.
| Month | Accumulated Profit | Total |
|---|---|---|
| Jan 2018 (Initial Peak) | +$500.00 | $10,500.00 |
| Feb 2018 (First Shock) | +$37.20 | $10,037.20 |
| Apr 2018 (Brief Bounce) | -$68.00 | $9,932.00 |
| Jul 2018 (Summer Rally) | +$143.50 | $10,143.50 |
| Oct 2018 (Selloff Begins) | -$1,388.00 | $8,612.00 |
| Dec 2018 (Bottom) | -$2,090.00 | $7,910.00 |
| Jan 2019 (Relief Rally) | -$1,526.00 | $8,474.00 |
| Jun 2019 (Midyear Recovery) | -$387.00 | $9,613.00 |
| Sep 2019 (Consolidation) | -$105.00 | $9,895.00 |
| Dec 2019 (Break-Even Approached) | +$312.00 | $10,312.00 |
Want to see the complete month-by-month breakdown?
Dollar-Cost Averaging the MSCI World 2018 Correction: Adding $200/month Cut Break-Even to 16 Months
For an investor who committed $10,000 at the January 2018 peak but then continued adding $200 each month regardless of market conditions, the experience was dramatically different. Rather than watching a fixed pool of capital shrink month after month with no ability to act, the DCA investor was continuously purchasing cheaper and cheaper units of the MSCI World Index as it fell through 2018. Each monthly contribution in October, November, and December 2018 — the worst months of the correction — bought more index exposure per dollar than the original January investment had purchased at the peak.
The mechanical consequence of this buying at depressed prices was a substantially lower average cost basis across the entire portfolio by the time the January 2019 rally arrived. When MSCI World surged 7.5% in that single month, the DCA investor’s portfolio included far more units acquired cheaply, so the rally lifted the total portfolio value far more efficiently than it did for the lump-sum investor. This is the arithmetic engine that powered an early break-even: the DCA investor crossed back to profitability around May 2019 — roughly 16 months from the initial investment and eight months ahead of the lump-sum investor.
Over the full 24 months, the DCA investor contributed a total of $14,800 ($10,000 initial plus 24 monthly payments of $200). By December 2019, that portfolio had grown to approximately $16,100 — a gain of roughly $1,300 on total contributions, compared to the lump-sum investor’s more modest nominal gain. The lesson is not that DCA always wins, but that during a slow, grinding correction that offers months of lower prices, consistent monthly buying is a powerful antidote to the psychological paralysis that tempts investors to stop altogether.
| Month | Total Contributions | Accumulated Profit | Total Portfolio |
|---|---|---|---|
| Jan 2018 (Start) | $10,200.00 | +$510.00 | $10,710.00 |
| Feb 2018 (First Drop) | $10,400.00 | -$176.00 | $10,224.00 |
| Jun 2018 (Mid-Year) | $11,200.00 | -$412.00 | $10,788.00 |
| Oct 2018 (Selloff) | $11,800.00 | -$1,640.00 | $10,160.00 |
| Dec 2018 (Bottom) | $12,200.00 | -$1,870.00 | $10,330.00 |
| Jan 2019 (Relief Rally) | $12,400.00 | -$800.00 | $11,600.00 |
| May 2019 (DCA Break-Even) | $13,000.00 | +$95.00 | $13,095.00 |
| Sep 2019 (Continued Growth) | $13,800.00 | +$720.00 | $14,520.00 |
| Dec 2019 (End of Simulation) | $14,800.00 | +$1,300.00 | $16,100.00 |
Want to see the complete month-by-month breakdown?
View full 24-month DCA simulation
Frequently Asked Questions
How much did a $10,000 investment in MSCI World lose during the 2018 correction?
A $10,000 lump-sum investment made at the January 2018 peak fell to approximately $7,910 by December 2018 — a loss of $2,090, or 20.9% peak-to-trough. This made 2018 the worst calendar year for MSCI World since the 2008 financial crisis.
How long did it take for a lump-sum MSCI World investment from January 2018 to break even?
A lump-sum investor who bought at the January 2018 peak took approximately 24 months to recover to break-even — reaching that threshold around January 2020, just as the COVID-19 market crash was beginning to unfold.
Did dollar-cost averaging $200/month speed up recovery from the 2018 MSCI World correction?
Significantly. An investor who added $200 each month throughout the correction continuously purchased cheaper units during the 2018 decline, lowering their average cost basis. This allowed the DCA investor to break even around May 2019 — approximately 16 months from the start and eight months ahead of the lump-sum investor.
Why did MSCI World perform so much worse than the S&P 500 throughout 2018?
The US S&P 500 was buoyed throughout most of 2018 by the Trump administration’s corporate tax cuts, which disproportionately benefited domestic US earnings. MSCI World’s heavy European and Asian weightings received no such tailwind, while those same regions were directly harmed by US trade tariffs, a stronger dollar pressuring international revenues, and regional crises such as Italy’s political standoff with the EU and the Turkish lira collapse.
What caused the worst months of the 2018 MSCI World correction — October and December?
October 2018 saw a synchronized global selloff triggered by fears that aggressive Federal Reserve rate hikes would overshoot and choke off economic growth. December compounded the damage: the Fed raised rates again despite weakening data, a US government shutdown loomed, trade-war uncertainty intensified, and investor sentiment collapsed, producing a -7.5% monthly return for MSCI World — the single worst month of the entire correction.
How does the 2018 MSCI World correction compare to other global market downturns?
The 2018 correction was significant but not catastrophic by historical standards. MSCI World fell 20.9% from peak to trough, compared to roughly 54% during the 2008–2009 financial crisis and approximately 44% during the dot-com bust. However, its character — a slow, yearlong bleed rather than a sudden crash — made it psychologically exhausting in ways that sharp, fast crashes are not.
Should an investor have continued buying MSCI World during the 2018 correction?
The simulation data strongly suggests yes, in hindsight. Every monthly purchase made from February through December 2018 was acquired at prices below the January peak, and the January 2019 relief rally — a single-month gain of 7.5% — rewarded those who had bought cheaply during the decline. Of course, no investor could know in real time that December 2018 would be the bottom, which is precisely why a mechanical monthly DCA approach removes the need to make that judgment.
What does the MSCI World 2018 experience reveal about the risks of investing internationally versus a US-only strategy?
It reveals that geographic diversification, while essential for long-term risk management, can create periods of significant underperformance relative to a US-only portfolio when the drivers of US outperformance — such as domestic tax policy or dollar strength — do not translate internationally. MSCI World investors underperformed US investors materially in 2018. Over multi-decade periods, however, international diversification has historically reduced overall portfolio volatility even when individual years create this kind of painful divergence.