$10,000 in MSCI World Before the 2008 Crash: Recovery Timeline & Results
It took a little more than 68 months (5 years and 8 months) for an investment in the MSCI World Index to recover and break even after the 2008 global financial crisis.
View the full simulation of the recovery for the MSCI World Index starting from the peak month (October 2007 to June 2013): Open Finance Simulation Calculator
Quick Answer: MSCI World 2008 Recovery (Including dividends)
- Peak: October 2007
- Bottom: Febuary 2009 (~-54%)
- Break-even: June 2013
- Total recovery time: ~68 months
What Is the Average Return of the MSCI World Index?
Historically, the MSCI World Index has delivered around 9% annual returns over the long term.
Here is multi assets calculator for historical average return for MSCI World Index (9.14%): Open Finance Simulation Calculator
What Happens If You Invest Before the 2008 Crash? (MSCI World Scenario)
If you invested at the worst possible moment before the 2008 crash, your portfolio would have dropped by nearly 54% — and taken years to recover.
$10,000 Invested in MSCI World Before the 2008 Crash
- Investment date: October 2007
- Initial investment: $10,000
- Index: MSCI World
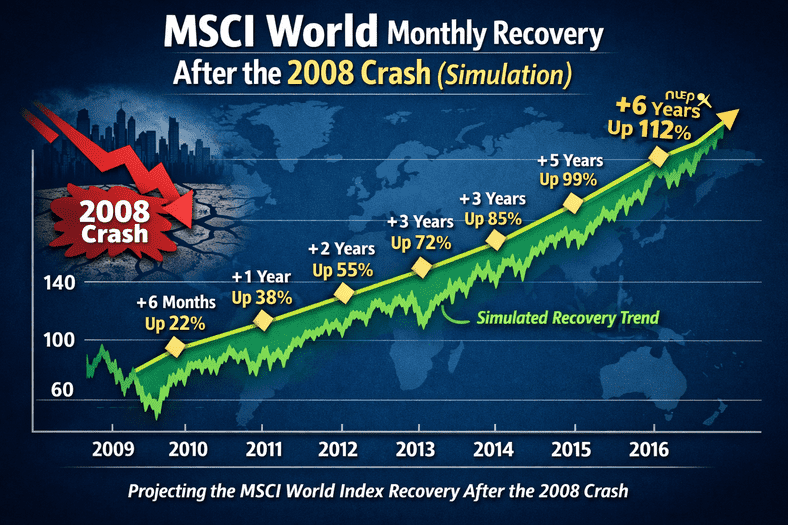
MSCI World Monthly Recovery After the 2008 Crash (Simulation)
The table below illustrates how a $10,000 lump-sum investment in the MSCI World Net Total Return Index evolved over time after the market peak in October 2007. Each row represents a key moment during the recovery period and demonstrates the impact of monthly market returns on the portfolio.
This simulation assumes no additional contributions and includes reinvested dividends, providing a realistic representation of long-term investor outcomes. The values are derived from historical monthly returns of the MSCI World Index.
How to Read the Table
- Month: The specific point in time during the recovery period.
- Start Amount: The portfolio value at the beginning of the period.
- Contribution: Additional investment made during the period (set to 0 for this scenario).
- Rate %: The MSCI World monthly return applied to the portfolio.
- Accumulated Profit: The cumulative gain or loss relative to the initial $10,000 investment.
- Total: The portfolio value after applying the monthly return.
The data highlights the severity of the 2008 financial crisis, with the portfolio reaching its lowest point in early 2009 before gradually recovering and surpassing the initial investment by June 2013.
| Month | Start Amount | Contribution | Rate % | Accumulated Profit | Total |
|---|---|---|---|---|---|
| October 2007 | 10,000.00 | 0 | -4.09 | -408.76 | 9,591.24 |
| January 2008 | 8,744.00 | 0 | -0.58 | -1,306.61 | 8,693.39 |
| June 2008 | 8,466.96 | 0 | -2.44 | -1,739.93 | 8,260.07 |
| October 2008 | 5,814.94 | 0 | -6.47 | -4,561.45 | 5,438.55 |
| February 2009 | 4,597.09 | 0 | 7.54 | -5,056.25 | 4,943.75 |
| March 2009 | 4,943.75 | 0 | 11.21 | -4,501.66 | 5,498.34 |
| July 2009 | 6,475.06 | 0 | 4.12 | -3,257.81 | 6,742.19 |
| September 2010 | 7,484.69 | 0 | 3.73 | -2,236.31 | 7,763.69 |
| October 2011 | 7,899.95 | 0 | -2.44 | -2,292.93 | 7,707.07 |
| February 2013 | 9,391.78 | 0 | 2.34 | -388.23 | 9,611.77 |
| June 2013 | 9,673.81 | 0 | 5.27 | 183.09 | 10,183.09 |
👉 Want to see the full month-by-month breakdown?
View full 68-month simulation →
What This Timeline Shows
The MSCI World recovery timeline provides valuable insights into how global equity markets behave during and after a major financial crisis. The key stages of the recovery include:
- 2007 – Market Peak: Global equity markets reached record highs before the onset of the financial crisis.
- 2008 – Severe Decline: The collapse of major financial institutions triggered a sharp global downturn.
- Early 2009 – Market Bottom: Investor sentiment reached extreme pessimism as markets hit their lowest levels.
- 2010–2012 – Gradual Recovery: Coordinated monetary and fiscal policies supported economic stabilization.
- 2013 – Break-Even Point: The MSCI World Index surpassed its pre-crisis peak on a total return basis.
What If You Keep Investing During the 2008 Crash? (Dollar-Cost Averaging)
While a lump-sum investment experienced significant short-term losses, many investors continue to invest during market downturns. The following table demonstrates the effect of Dollar-Cost Averaging (DCA), where an additional $200 is invested each month throughout the crisis and recovery period.
By consistently purchasing shares at lower prices during the downturn, DCA reduces the average cost per share and accelerates the recovery of the portfolio. This disciplined approach often leads to improved long-term outcomes compared to a single lump-sum investment.
Key Differences Compared to the Lump-Sum Scenario
- Faster Recovery: Regular contributions help the portfolio recover more quickly.
- Reduced Volatility Impact: Investing during market lows lowers the average purchase price.
- Higher Final Value: The portfolio benefits from compounding on both the initial investment and subsequent contributions.
This simulation clearly illustrates how maintaining investment discipline during periods of market stress can significantly enhance long-term wealth accumulation.
| Month | Start Amount | Contribution | Rate % | Accumulated Profit | Total |
|---|---|---|---|---|---|
| October 2007 | 10,000.00 | 200 | -4.17 | -416.93 | 9,783.07 |
| January 2008 | 9,285.93 | 200 | -0.59 | -1,368.97 | 9,431.03 |
| June 2008 | 9,947.75 | 200 | -2.49 | -1,900.21 | 9,899.79 |
| October 2008 | 7,414.96 | 200 | -6.65 | -5,477.95 | 7,122.05 |
| February 2009 | 6,532.50 | 200 | 7.77 | -6,159.81 | 7,240.19 |
| July 2009 | 10,413.20 | 200 | 4.21 | -3,348.95 | 11,051.05 |
| September 2010 | 15,033.91 | 200 | 3.78 | -1,398.24 | 15,801.76 |
| October 2011 | 18,394.02 | 200 | -2.47 | -1,659.97 | 18,140.03 |
| March 2013 | 26,266.94 | 200 | 3.17 | 4,100.40 | 27,300.40 |
| June 2013 | 27,027.98 | 200 | 5.30 | 4,861.43 | 28,661.43 |
👉 Want to see the full month-by-month breakdown?
View full 68-month simulation →
MSCI World Recovery Over 15 Years After 2008 Crisis
To better understand the long-term resilience of global equity markets, the table below summarizes the performance of a $10,000 investment in the MSCI World Total Return Index over different time horizons following the October 2007 peak.
Rather than focusing on monthly fluctuations, this overview highlights cumulative returns after 1, 5, 10, and 15 years. It demonstrates how time in the market plays a crucial role in overcoming short-term volatility and achieving positive long-term results.
Understanding the Columns
- Period: The length of time since the initial investment.
- Start Amount: The initial investment of $10,000.
- Contribution: Additional investments (set to 0 in this scenario).
- Total Return %: The cumulative percentage change in the MSCI World Index over the period.
- Accumulated Profit: The monetary gain or loss relative to the initial investment.
- Total: The final portfolio value at the end of the period.
Despite the severe downturn immediately following the 2007 peak, the MSCI World Index demonstrates strong long-term growth. Investors who remained invested for 15 years benefited from the power of compounding and global economic recovery.
| Period | Start Amount | Contribution | Total Return % | Accumulated Profit | Total |
|---|---|---|---|---|---|
| 1 Year | 10,000 | 0 | 7.4% | 740 | 10,740 |
| 5 Years | 10,000 | 0 | -19.3% | -1,932 | 8,068 |
| 10 Years | 10,000 | 0 | 20.7% | 2,066 | 12,066 |
| 15 Years | 10,000 | 0 | 73.3% | 7,326 | 17,326 |
Final Takeaway
Even a perfectly timed bad investment eventually recovers.
The MSCI World shows that global diversification doesn’t prevent crashes — but it still delivers strong long-term results.
Compare this with our analyses of the S&P 500 and Dow Jones recoveries after the 2008 financial crisis.
MSCI World and the 2008 Financial Crisis – FAQs
How much did the MSCI World Index fall during the 2008 financial crisis?
The MSCI World Net Total Return Index declined by approximately 50% to 55% from its peak in October 2007 to its trough in February–March 2009, reflecting the global impact of the financial crisis.
When did the MSCI World reach its lowest point during the crisis?
The index reached its bottom between February and March 2009, when global equity markets were under severe stress following the collapse of major financial institutions and a deep global recession.
How long did it take the MSCI World to recover after the 2008 crash?
On a total return basis, including reinvested dividends, the MSCI World Index recovered to its pre-crisis peak by around June 2013, meaning the recovery took approximately 68 months.
Did dividends play a role in the MSCI World’s recovery?
Yes. Reinvested dividends significantly accelerated the recovery. The Net Total Return version of the MSCI World reached break-even earlier than the price-only version, highlighting the importance of dividends in long-term investing.
Would diversification in the MSCI World have prevented losses during the crisis?
No. Because the 2008 financial crisis was global in nature, most equity markets declined simultaneously. However, the MSCI World’s geographic diversification helps reduce country-specific risks and supports long-term resilience.
How did the MSCI World compare to the S&P 500 during the 2008 crisis?
Both indices experienced similar declines of around 50% or more. The S&P 500, being U.S.-focused, recovered slightly earlier in some cases, while the MSCI World reflected a broader global recovery across developed markets.
What lessons can investors learn from the MSCI World’s performance during the 2008 crisis?
Key lessons include the importance of long-term investing, the benefits of dividend reinvestment, and the value of diversification. Despite severe short-term losses, patient investors were rewarded as markets eventually recovered.
Related:
- What If You Invested 10,000 in the S&P 500 Before the 2008 Crash? (Recovery Timeline)
- NASDAQ 2008 Crash: What $10,000 Became (+ Recovery Time & Returns)
- $10,000 in Dow Jones Before 2008 Crash: What Happened Next?
- What If You Invested $10,000 Before the 2008 Crash? S&P 500 vs NASDAQ vs Dow Jones vs MSCI World