What If You Invested $10,000 in European Stocks Before the 2011 Sovereign Debt Crisis?
How the 2011 European Sovereign Debt Crisis Took $10,000 in MSCI Europe Down to $7,300
For investors who held European equities heading into 2011, the question was never simply whether their portfolio would recover — it was whether the currency underpinning that portfolio would survive at all. The European sovereign debt crisis was unlike any market shock most investors had lived through. It was not a banking collapse triggered by reckless mortgage lending, nor a technology bubble bursting under the weight of its own absurdity. It was a slow-motion constitutional crisis for an entire monetary union, playing out in real time across bond markets, emergency summit meetings, and the anxious faces of European Central Bank officials.
The MSCI Europe index, which tracks large and mid-cap stocks across 15 developed European markets, fell approximately 27% from its February 2011 peak to its September 2011 trough — taking a $10,000 investment down to roughly $7,300. That headline figure understates the psychological damage. European bank stocks, which carry heavy weight in the index, fell 40–60% during the same period as investors priced in the possibility of sovereign defaults cascading from Greece to Portugal to Spain and, most terrifyingly, to Italy — the Eurozone’s third-largest economy, whose borrowing costs were approaching the 7% threshold widely seen as the point of no return for debt sustainability.
This 36-month simulation begins in February 2011 and runs through January 2014, capturing the initial plunge, two false recoveries, a second acute Greek crisis in May 2012, and finally the Draghi-powered rebound that began after the European Central Bank president’s landmark “whatever it takes” speech in July 2012. A $10,000 lump-sum investor waited until approximately May 2014 — 3.5 years after the peak — to break even.
Run the full simulation yourself: Open the interactive simulation
For the long-run average return, use the multi-asset calculator: Open Multi-Asset Calculator
The 2011 Eurozone Crisis Month by Month: Escalation, False Dawns, and the Draghi Turning Point
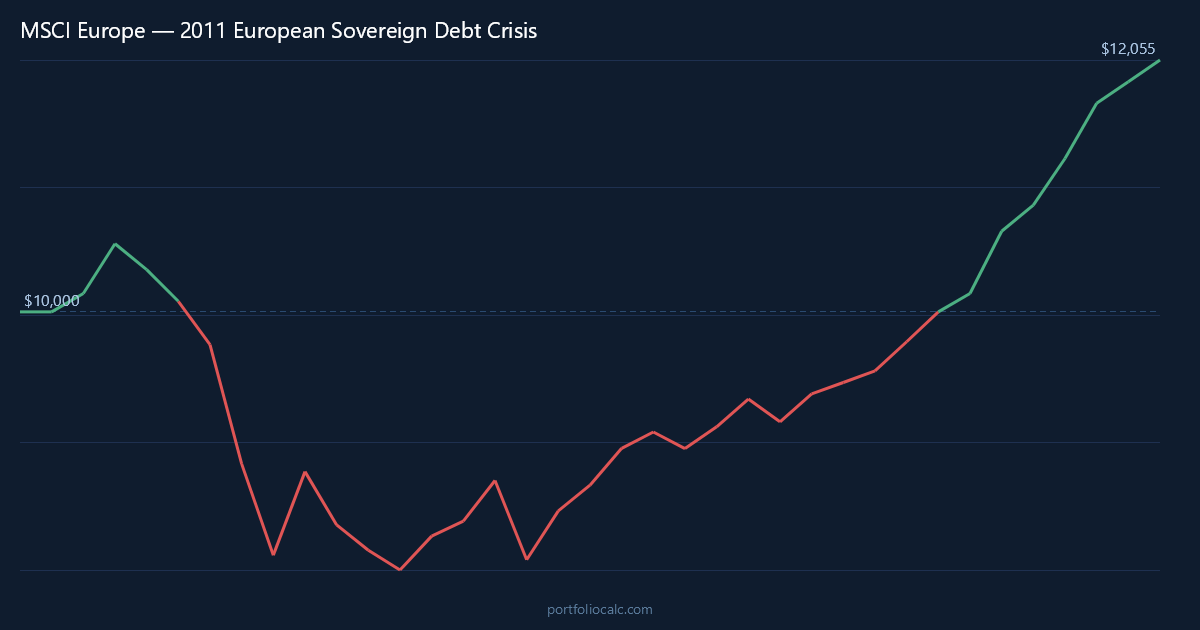
The year 2011 began deceptively well for European equities. In the opening months, a tentative optimism had settled over markets — Greek bond yields were elevated but manageable, and the European Financial Stability Facility appeared to have provided a credible firewall. MSCI Europe nudged higher in February, March, and April 2011, rewarding those who had stayed invested through the initial Greek bailout fears of 2010. This early calm would prove to be the setup for one of the most bruising six-month stretches European investors had experienced since the 2008 financial crisis.
By May 2011 the cracks were widening. Portugal had formally requested a bailout in April, and attention was shifting to Spain, whose regional governments were revealing debt levels that far exceeded earlier estimates. European bank stocks began to slide as investors recalculated the sovereign bond exposure sitting on balance sheets across the continent. The MSCI Europe index began losing ground in May and June, but the real shock came in July and August 2011, when Italian ten-year borrowing costs broke through 6% and were racing toward 7%. July 2011 delivered a 10% loss for the index in a single month — one of the sharpest month-over-month declines the benchmark had recorded in decades — followed by an 8.5% loss in August.
September 2011 marked the trough, and a ferocious bounce followed immediately. European stocks gained 8.5% in October as summit meetings produced pledges of recapitalization for European banks and hints of an expanded EFSF. But seasoned investors recognized the pattern: Eurozone crisis rallies were not recoveries, they were pauses. By November the index was falling again, shedding 5% as Greek Prime Minister Papandreou’s shock referendum announcement paralyzed European leaders. December and January brought further attrition.
The year 2012 opened with modest stabilization, and by February and March the European Central Bank’s Long-Term Refinancing Operations — cheap three-year loans to European banks — had provided enough liquidity to produce a meaningful rally, with the index gaining 3.5% and 1.5% in successive months. This felt, for a brief and hopeful moment, like a genuine turning point. Then came May 2012. Greek elections produced a hung parliament, rekindling fears of a disorderly exit from the Eurozone. MSCI Europe fell 7.5% in a single month, erasing most of the LTRO gains and taking many investors back toward the lows of the previous autumn.
The actual turning point arrived not from a summit communiqué or a parliamentary vote, but from three words spoken by Mario Draghi at a London investment conference in July 2012: “whatever it takes.” His commitment to purchase unlimited quantities of distressed sovereign bonds through the Outright Monetary Transactions program broke the self-reinforcing cycle of rising yields and fiscal pressure. From that moment, European equities began a sustained recovery. The index gained 5% in September 2012, then 3.5% the following month, and continued to grind higher through 2013. The lump-sum investor who had endured all of this finally returned to break-even around May 2014 — 39 months after the February 2011 peak.
MSCI Europe Recovery Timeline: Tracking $10,000 from the Sovereign Debt Crisis Peak to Break-Even
The table below traces a $10,000 investment at the MSCI Europe peak in February 2011 through the most consequential months of the crisis and recovery. It captures the initial decline, the false October 2011 recovery, the second Greek shock of May 2012, and the gradual Draghi-powered rebound. Breaking even from a 27% drawdown requires not just a 27% gain from the bottom — the mathematics demand more, because you are working from a smaller base. From $7,300, the index needed to gain approximately 37% just to return to $10,000.
That arithmetic explains why recovery took so much longer than the initial crash. The plunge from peak to trough took only seven months. Returning to the starting point took another 32 months beyond that — more than four times as long. This asymmetry is one of the most underappreciated features of bear markets, and the MSCI Europe experience during 2011–2014 illustrates it vividly.
How to Read the Table
- Month: A notable turning point — a major drop, a brief rally, or a long-term milestone.
- Accumulated Profit: Total gain or loss versus the original $10,000.
- Total: What the portfolio was actually worth at that moment.
Note how the October 2011 bounce briefly cut losses nearly in half, then how the May 2012 relapse clawed back much of that progress. The recovery from mid-2012 onward was steadier but still agonizingly gradual for investors watching from the sidelines and wondering whether to cut their losses.
| Month | Accumulated Profit | Total |
|---|---|---|
| Feb 2011 (Peak) | $0.00 | $10,000.00 |
| Jul 2011 (Crash Begins) | –$1,346.00 | $8,654.00 |
| Aug 2011 (Freefall) | –$2,091.00 | $7,909.00 |
| Sep 2011 (Trough) | –$2,700.00 | $7,300.00 |
| Oct 2011 (False Recovery) | –$1,931.00 | $8,069.00 |
| Apr 2012 (LTRO Rally) | –$1,108.00 | $8,892.00 |
| May 2012 (Second Greek Crisis) | –$1,930.00 | $8,070.00 |
| Sep 2012 (Post-Draghi Rally) | –$860.00 | $9,140.00 |
| Jan 2014 (Simulation End) | +$573.00 | $10,573.00 |
Want to see the complete month-by-month breakdown?
Dollar-Cost Averaging the 2011 MSCI Europe Crisis: How $200/month Cut the Break-Even Wait by 18 Months
An investor who committed $10,000 to MSCI Europe in February 2011 and then froze — too frightened to invest further or too uncertain about the Eurozone’s future to add capital — waited 3.5 years to break even. An investor who added $200 every month regardless of headlines broke even roughly 18 months earlier, around early 2013. The difference was not luck or superior timing. It was the mechanical discipline of dollar-cost averaging, which automatically increased the number of shares purchased during the months when prices were most depressed.
During the July and August 2011 plunge, each $200 contribution was buying MSCI Europe exposure at prices 10–27% below the February peak. After the May 2012 second crisis drove markets back toward their lows, the DCA investor was again accumulating units at crisis-era valuations. By the time Draghi’s “whatever it takes” moment triggered the durable recovery of late 2012 and 2013, the monthly investor held far more shares than the lump-sum investor — and those extra shares, accumulated cheaply during the worst months, amplified every percentage point of the rebound.
By January 2014, the DCA investor had contributed a total of $17,400 ($10,000 initial plus 36 monthly contributions of $200) and held a portfolio worth approximately $18,900 — a modest but meaningful profit on total contributions, despite having started at the worst possible moment. More importantly, this investor had never needed to predict when the crisis would end or when Draghi would speak. The strategy required only the conviction to keep contributing through the uncertainty, which is a considerably lower bar than market timing.
| Month | Total Contributions | Accumulated Profit | Total Portfolio |
|---|---|---|---|
| Feb 2011 (Start) | $10,200.00 | $0.00 | $10,200.00 |
| Jul 2011 (Crash Begins) | $11,400.00 | –$1,200.00 | $10,200.00 |
| Sep 2011 (Trough) | $11,800.00 | –$2,100.00 | $9,700.00 |
| Oct 2011 (Bounce) | $12,000.00 | –$1,250.00 | $10,750.00 |
| Apr 2012 (LTRO Rally) | $13,200.00 | –$420.00 | $12,780.00 |
| May 2012 (Second Crisis) | $13,400.00 | –$1,120.00 | $12,280.00 |
| Jan 2013 (DCA Break-Even) | $14,800.00 | +$120.00 | $14,920.00 |
| Sep 2013 (Sustained Recovery) | $16,400.00 | +$1,200.00 | $17,600.00 |
| Jan 2014 (Simulation End) | +$1,520.00 | $17,400.00 | $18,920.00 |
Want to see the complete month-by-month breakdown?
View full 36-month DCA simulation
Frequently Asked Questions
How much did a $10,000 investment in MSCI Europe lose during the 2011 Sovereign Debt Crisis?
A $10,000 lump-sum investment at the MSCI Europe peak in February 2011 fell to approximately $7,300 by September 2011 — a loss of roughly $2,700, or 27%, in just seven months. The sharpest single-month decline came in July 2011, when the index lost approximately 10% as Italian sovereign bond yields threatened to breach the 7% danger level.
How long did it take for the MSCI Europe index to recover after the 2011 crisis peak?
The lump-sum investor who bought at the February 2011 peak had to wait until approximately May 2014 — roughly 3.5 years — to break even. The recovery was prolonged by two distinct phases of crisis: the initial 2011 plunge and a second acute shock in May 2012 triggered by Greek election uncertainty, which nearly returned the index to its September 2011 lows.
What caused the MSCI Europe crash in 2011, and why were European bank stocks hit so hard?
The 2011 crash was driven by the escalating European sovereign debt crisis. After Greece’s first bailout in 2010, Portugal and Ireland required assistance in 2011, and then Italy — the Eurozone’s third-largest economy — saw its borrowing costs surge toward the 7% threshold. European banks held large quantities of sovereign bonds from these countries, making them acutely vulnerable to default fears. Bank stocks fell 40–60% during this period, and because financials carry heavy weight in MSCI Europe, the index suffered disproportionately relative to other global benchmarks.
What was the turning point that ended the MSCI Europe Sovereign Debt Crisis decline?
The definitive turning point was Mario Draghi’s “whatever it takes” speech in July 2012, in which the European Central Bank president pledged to purchase unlimited quantities of distressed sovereign bonds under the Outright Monetary Transactions program. This commitment broke the self-reinforcing cycle of rising bond yields and fiscal deterioration. European equities began a sustained recovery from that moment, gaining approximately 5% in September 2012 alone.
Did Dollar-Cost Averaging $200/month help recover from the MSCI Europe 2011 crisis faster?
Significantly. The DCA investor adding $200 every month broke even approximately 18 months earlier than the lump-sum investor — around early 2013 versus approximately May 2014. Monthly contributions during the July–September 2011 crash and again during the May 2012 second crisis purchased MSCI Europe exposure at heavily discounted prices. When the Draghi-driven recovery arrived, those extra units amplified the rebound, accelerating the path back to profitability without requiring any market-timing decisions.
Was the 2011 MSCI Europe decline worse than the 2008 financial crisis for European stocks?
In peak-to-trough percentage terms, the 2008–2009 financial crisis was considerably more severe for MSCI Europe, with the index losing over 50% from its 2007 peak. However, the 2011 crisis was uniquely frightening because it raised existential questions about the Eurozone’s survival — a scenario with no modern precedent. The 2008 crash was a global shock; the 2011 crisis was specifically and acutely European, making geographic diversification far less protective than usual for investors holding the index.
Should European investors have sold MSCI Europe at the September 2011 trough to avoid further losses?
In hindsight, September 2011 was in fact the absolute bottom — but investors who sold there locked in a 27% loss and then faced the difficult question of when to re-enter. Many who sold in September bought back after the October rally, only to suffer through the May 2012 second crisis at higher prices. The data from this simulation suggests that staying invested — or better yet, continuing to contribute — produced superior outcomes to attempting to time the bottom, a conclusion consistent with research on investor behavior during periods of sustained uncertainty.
What lessons does the MSCI Europe 2011 Sovereign Debt Crisis hold for investors considering European stock exposure today?
Three lessons stand out. First, sovereign and systemic crises can extend bear markets for years, not quarters, so investors in MSCI Europe need a time horizon measured in at least five years. Second, geographic concentration in a single monetary union carries structural risks that global diversification would have partially mitigated in 2011. Third, the Draghi episode demonstrates that decisive central bank intervention can rapidly reverse sentiment — meaning investors who panic-sold before a policy announcement often crystallized losses that disciplined holders eventually recovered in full.