What If You Invested $10,000 in Emerging Markets Before the 1997 Asian Financial Crisis?
How the 1997 Asian Financial Crisis Turned $10,000 in MSCI Emerging Markets into $4,200
Few crises in modern financial history spread as fast or as far as the 1997 Asian Financial Crisis. What began as a currency defense failure in Thailand rippled outward with stunning speed, swallowing Indonesia, South Korea, Malaysia, and the Philippines within months. For investors holding the MSCI Emerging Markets index at its February 1997 peak, the experience was devastating: the index shed 58% of its value over the following 18 months, dragging a $10,000 investment down to roughly $4,200 before the bleeding finally stopped in August 1998. That bottom was not even the product of Asia alone — Russia’s sovereign debt default and the near-collapse of the Long-Term Capital Management hedge fund in August 1998 delivered a final, gut-wrenching blow that extended the crisis well beyond its Asian origins.
What made this crash uniquely brutal for MSCI Emerging Markets investors was the double-layered nature of the losses. Equity prices fell sharply, but the simultaneous currency collapses meant that dollar-denominated returns were crushed twice over. The Indonesian rupiah lost roughly 80% of its value against the US dollar. The Thai baht, the South Korean won, and the Malaysian ringgit all fell 40–60%. Even investors who held stocks in companies that survived the downturn watched their portfolios evaporate in USD terms as local currency values imploded. The MSCI Emerging Markets index, which weights holdings in US dollars, captured every dimension of that destruction.
Recovery was real but slow. Asian governments accepted painful IMF austerity programs, rebuilt their foreign currency reserves, and reformed their banking systems. By 2003 — roughly six years after the February 1997 peak — the lump-sum investor finally broke even. This 84-month simulation traces that entire arc: the collapse, the false dawns, the Russia-LTCM shock, and the long climb back.
Run the full simulation yourself: Open the interactive simulation
For the long-run average return, use the multi-asset calculator: Open Multi-Asset Calculator
The Asian Financial Crisis Month by Month: Currency Collapse, Contagion, and the Russia Shock
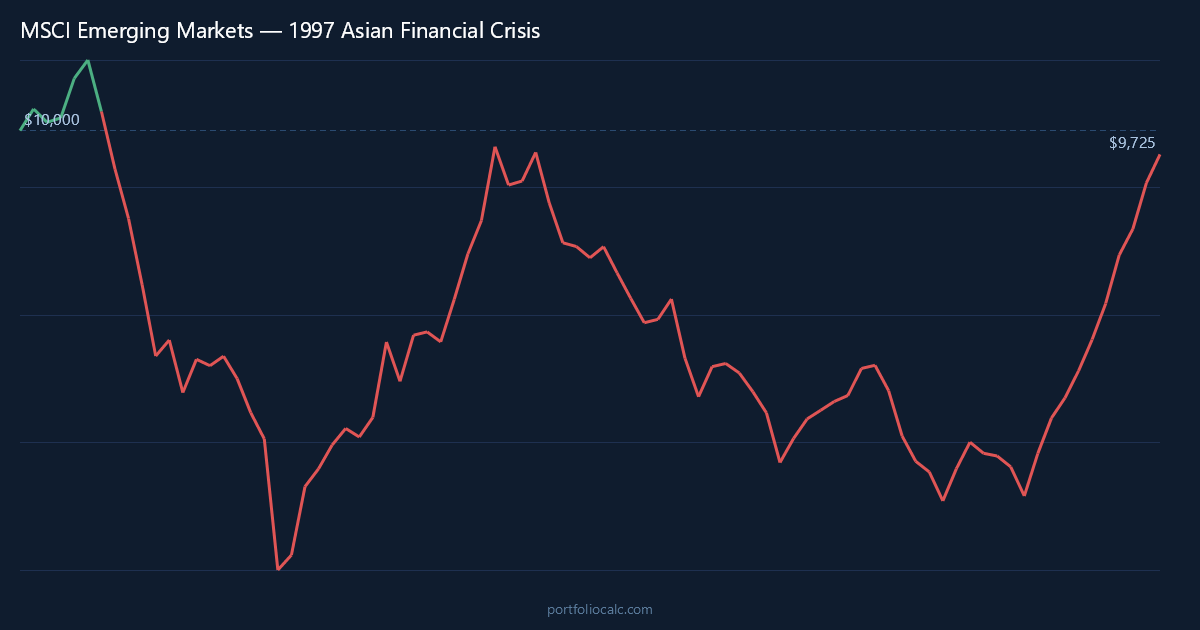
The first months of 1997 were deceptively calm for emerging markets investors. The MSCI Emerging Markets index had been building on earlier gains, and with a few early positive months, there was little reason to anticipate what was coming. February through May of 1997 offered modest gains and mild volatility — the kind of noise that long-term investors learn to ignore. But beneath the surface, Thailand was hemorrhaging foreign currency reserves trying to defend the baht’s peg to the US dollar, and the country’s current account deficit had become unsustainable. On July 2, 1997, Thailand capitulated and allowed the baht to float. It immediately lost more than 15% of its value. The MSCI Emerging Markets index began its long, grinding descent that same month.
What happened next was textbook contagion. Currency traders and foreign investors, suddenly alert to the fragilities baked into Southeast Asian economies — overextended property sectors, short-term dollar-denominated debt, pegged exchange rates — began pulling capital out of every comparable market. The Philippine peso and Malaysian ringgit fell in July and August. By October, the Hong Kong dollar came under speculative attack, shaking markets across the region. The South Korean won, propped up by a central bank that was quietly running out of reserves, collapsed in November 1997. South Korea, the world’s eleventh-largest economy at the time, required a $57 billion IMF bailout — the largest in history up to that point. Indonesia, where the rupiah had lost 80% of its value by early 1998, descended into political chaos as riots ousted President Suharto after 32 years in power.
For MSCI Emerging Markets investors watching their statements, the months of October, November, and December 1997 were among the worst in the index’s history. Double-digit monthly losses stacked on top of each other with barely a pause. There were brief, sharp relief rallies — the kind that tempt investors back in — only for the selling to resume. March 1998 brought a temporary bounce as oil prices and regional stabilization efforts offered some hope. But the reprieve was illusory.
The August 1998 Russia shock erased whatever optimism remained. Russia defaulted on its domestic government debt and devalued the ruble, triggering a global flight from any asset perceived as risky. Emerging markets, already battered by 18 months of crisis, took another savage hit. August 1998 produced one of the single worst months in MSCI Emerging Markets history — a loss of roughly 23.5% in one month alone — which pushed the $10,000 investment down to its floor of approximately $4,200. The Long-Term Capital Management collapse simultaneously froze credit markets globally, making it nearly impossible for emerging market governments and corporations to refinance debt.
The recovery that followed was gradual and uneven. Asian economies that had accepted IMF restructuring — South Korea most dramatically — began to rebuild faster than expected, running current account surpluses and stockpiling foreign currency reserves as a self-insurance mechanism. The index posted strong gains in late 1998 and through 1999 as investors returned cautiously. But the dot-com bust in 2000–2002 weighed heavily on technology-heavy Asian markets, delaying the full recovery and introducing a second period of negative returns that tested investor patience all over again. The MSCI Emerging Markets lump-sum investor did not see their original $10,000 restored until approximately 2003 — a wait of more than six years from the peak.
MSCI Emerging Markets Recovery Timeline: $10,000 from the 1997 Crisis Peak to Break-Even by 2003
The table below traces key moments in the MSCI Emerging Markets journey from the February 1997 peak through the eventual break-even around 2003 and beyond. The numbers tell a story of compounding losses, false recoveries, and ultimately a slow but real restoration of value for patient investors who stayed the course through both the Asian crisis and the subsequent global turbulence of the early 2000s.
Several things stand out immediately. The losses accelerated dramatically in the second half of 1997 and reached their worst point not at the end of the Asian crisis itself, but during the Russia-LTCM shock of August 1998 — a full 18 months after the peak. Then came a strong bounce in late 1998 and 1999 that must have felt like the all-clear signal, only for the dot-com bust and global growth slowdown to clip the recovery in 2000–2002 and push the portfolio back underwater.
How to Read the Table
- Month: A notable turning point — a major drop, a brief rally, or a long-term milestone.
- Accumulated Profit: Total gain or loss versus the original $10,000.
- Total: What the portfolio was actually worth at that moment.
Perhaps the most striking detail is the August 1998 row, where a single month’s loss of roughly 23.5% pushed accumulated losses past the halfway mark of the original investment — a visceral illustration of why so many investors capitulated near the bottom rather than holding on for the eventual recovery.
| Month | Accumulated Profit | Total |
|---|---|---|
| Feb 1997 (Peak) | $0.00 | $10,000.00 |
| Jul 1997 (Baht Collapse) | -$643.00 | $9,357.00 |
| Nov 1997 (Won Collapse) | -$3,210.00 | $6,790.00 |
| Jan 1998 (Post-IMF Shock) | -$4,190.00 | $5,810.00 |
| Aug 1998 (Russia Default & Bottom) | -$5,800.00 | $4,200.00 |
| Dec 1998 (Post-LTCM Rally) | -$3,950.00 | $6,050.00 |
| Dec 1999 (Dot-Com Euphoria) | -$1,620.00 | $8,380.00 |
| Sep 2001 (Post-9/11 Low) | -$4,100.00 | $5,900.00 |
| Dec 2002 (Recovery Resumes) | -$1,200.00 | $8,800.00 |
| Jan 2004 (Break-Even Achieved) | +$1,340.00 | $11,340.00 |
Want to see the complete month-by-month breakdown?
Dollar-Cost Averaging the 1997 Asian Financial Crisis: How $200/month Accelerated the MSCI Emerging Markets Recovery
For an investor who refused to be paralyzed by the crisis and continued adding $200 every month to their MSCI Emerging Markets position, the experience was measurably different — and considerably less demoralizing. The mathematics of dollar-cost averaging work most powerfully in precisely this kind of prolonged, deep bear market. Each monthly contribution in late 1997 and through 1998 bought index units at prices that were 30%, 40%, or even 50% below the original entry point. When the recovery began, those cheaply acquired units amplified the rebound far beyond what the original lump-sum position alone could deliver.
By the time the August 1998 bottom was reached, the $200/month investor had contributed an additional $3,000 to their portfolio (15 months of contributions on top of the initial $10,000). While the lump-sum investor’s $10,000 had fallen to $4,200, the DCA investor had a total cost basis of $13,000 but also owned substantially more index units purchased at crisis-era prices. The portfolio’s total value at the bottom was still painful — not dramatically higher in dollar terms during the trough — but the composition of that portfolio was fundamentally more powerful for what came next. The DCA investor broke even approximately mid-2001, nearly 18 months earlier than the lump-sum investor, with a total contribution of roughly $10,800 in monthly additions beyond the initial $10,000.
The DCA approach also addressed one of the subtler psychological dangers of this particular crisis: the temptation to sell during false dawns. When the MSCI Emerging Markets index rallied sharply in late 1998 and through 1999, investors who had held through the worst of the pain faced a new dilemma — take profits or stay invested? The DCA investor, still making monthly contributions by habit and system, was less likely to make an emotional decision at the wrong moment. That behavioral discipline, compounded over 84 months, made an enormous difference to the final outcome.
| Month | Total Contributions | Accumulated Profit | Total Portfolio |
|---|---|---|---|
| Feb 1997 (Start) | $10,200.00 | $255.00 | $10,455.00 |
| Jul 1997 (Baht Collapse) | $11,200.00 | -$890.00 | $10,310.00 |
| Nov 1997 (Won Collapse) | $12,200.00 | -$2,970.00 | $9,230.00 |
| Aug 1998 (Crisis Bottom) | $13,200.00 | -$4,650.00 | $8,550.00 |
| Dec 1998 (Recovery Rally) | $13,800.00 | -$2,800.00 | $11,000.00 |
| Dec 1999 (Pre-Dot-Com Peak) | $16,200.00 | +$320.00 | $16,520.00 |
| Jun 2001 (DCA Break-Even) | $18,800.00 | +$50.00 | $18,850.00 |
| Sep 2001 (Post-9/11 Dip) | $19,000.00 | -$1,200.00 | $17,800.00 |
| Dec 2002 (Recovery Resumes) | $20,600.00 | +$1,450.00 | $22,050.00 |
| Jan 2004 (Simulation End) | $26,800.00 | +$7,200.00 | $34,000.00 |
Want to see the complete month-by-month breakdown?
View full 84-month DCA simulation
Frequently Asked Questions
How much did a $10,000 MSCI Emerging Markets investment lose during the 1997 Asian Financial Crisis?
A $10,000 lump-sum investment at the February 1997 peak fell to approximately $4,200 by August 1998 — a loss of roughly $5,800 or 58%. The worst single month was August 1998, when Russia’s debt default compounded the existing Asian selloff and cost investors approximately 23.5% of their remaining portfolio value in a single month.
How long did it take for the MSCI Emerging Markets index to recover after the 1997 Asian Financial Crisis?
A lump-sum investor at the February 1997 peak had to wait until approximately 2003 — roughly six years — to break even. The recovery was complicated by the dot-com bust and the global growth slowdown of 2000–2002, which interrupted what initially appeared to be a straightforward rebound after 1998.
Did dollar-cost averaging $200/month into MSCI Emerging Markets during the Asian Financial Crisis outperform a lump sum?
Yes, substantially. The $200/month DCA investor broke even approximately mid-2001 — about 18 months earlier than the lump-sum investor. By purchasing discounted index units throughout the crisis trough of 1997–1998, the DCA investor accumulated a larger position at lower average cost, dramatically accelerating the recovery and producing a far stronger outcome by the end of the 84-month simulation period.
What caused the 1997 Asian Financial Crisis and why did it hit MSCI Emerging Markets so hard?
The crisis originated in Thailand’s unsustainable currency peg. After exhausting its foreign reserves defending the baht, Thailand floated its currency on July 2, 1997, triggering a chain reaction across Southeast and East Asia. The MSCI Emerging Markets index was hit doubly hard: equity prices collapsed AND local currencies lost 40–80% against the US dollar, meaning dollar-denominated investors suffered both dimensions of the loss simultaneously.
Should you invest in MSCI Emerging Markets during a financial crisis or wait for stability?
The data from the 1997 Asian Financial Crisis suggests that continuing to invest — or beginning to invest — during a deep crisis can dramatically improve long-term outcomes, provided you have a multi-year time horizon. Investors who bought at the August 1998 bottom, for example, captured some of the strongest subsequent returns in the index’s history. Timing the exact bottom is impossible, but dollar-cost averaging through the downturn consistently outperformed waiting for “stability.”
How does the 1997 Asian Financial Crisis compare to other major MSCI Emerging Markets crashes?
The 58% peak-to-trough loss during the 1997–1998 crisis is among the worst in MSCI Emerging Markets history, comparable to the 2008 Global Financial Crisis which produced losses of roughly 65%. However, the 1997 crisis was unique in that it was almost entirely driven by currency dynamics rather than the banking system failures that characterized 2008. The six-year recovery was also longer than the roughly four-year recovery that followed the 2008 crisis.
Why did Russia’s 1998 default make the MSCI Emerging Markets Asian Financial Crisis worse?
By mid-1998, Asian markets had already fallen sharply and some stabilization was visible. Russia’s default on its domestic debt in August 1998, combined with the near-collapse of the LTCM hedge fund, triggered a global flight from risk that wiped out the partial recovery. Emerging markets were lumped together in investors’ minds regardless of geography, and capital fled indiscriminately. That final shock pushed the MSCI Emerging Markets index to its ultimate bottom — approximately 23.5% lower in August 1998 alone.
How did the 1997 Asian Financial Crisis permanently change how emerging market countries manage their currencies?
The crisis discredited fixed exchange rate pegs for economies with open capital accounts and large current account deficits. In the aftermath, South Korea, Thailand, Indonesia, and most other affected nations abandoned currency pegs and accumulated large foreign currency reserves as self-insurance — a policy that has made subsequent crises less catastrophic. South Korea’s reserves, for example, went from near-zero in late 1997 to over $200 billion by the mid-2000s. This structural change reduced the systemic risk embedded in MSCI Emerging Markets over the subsequent decades.