What If You Invested $10,000 in the Dow Jones Before Black Monday 1987?
How Black Monday Turned $10,000 in the Dow Jones into $6,000 in Under Three Months
No single day in the history of modern finance compares to October 19, 1987. The Dow Jones Industrial Average shed 22.6% of its value in one trading session — a figure so extreme that it dwarfs the worst days of the dot-com bust, the 2008 financial crisis, and the COVID-19 panic of March 2020 combined. If you had invested $10,000 at the Dow’s August 1987 peak, that position would have fallen to roughly $6,000 by December 1987, a 40% total drawdown that arrived with almost no warning and left investors scrambling for answers.
What makes the 1987 crash particularly fascinating — and instructive — is what did not happen afterward. The United States did not enter a recession. Corporate earnings did not collapse. The banking system did not seize up. Within 24 months of the August 1987 peak, the Dow had clawed its way back to break-even, and the investor who held through the chaos was made whole by August 1989. For those who added $200 per month throughout the drawdown, break-even arrived even sooner: December 1988, under 16 months from the crash.
This 30-month simulation walks through the full episode — the terrifying plunge, the volatile recovery, and the surprisingly swift return to pre-crash levels — so you can understand exactly what holding (or dollar-cost averaging into) the Dow Jones through Black Monday would have felt like in real time.
Run the full simulation yourself: Open the interactive simulation
For the long-run average return, use the multi-asset calculator: Open Multi-Asset Calculator
Black Monday 1987 Month by Month: Program Trading, Panic, and a Faster Recovery Than Anyone Expected
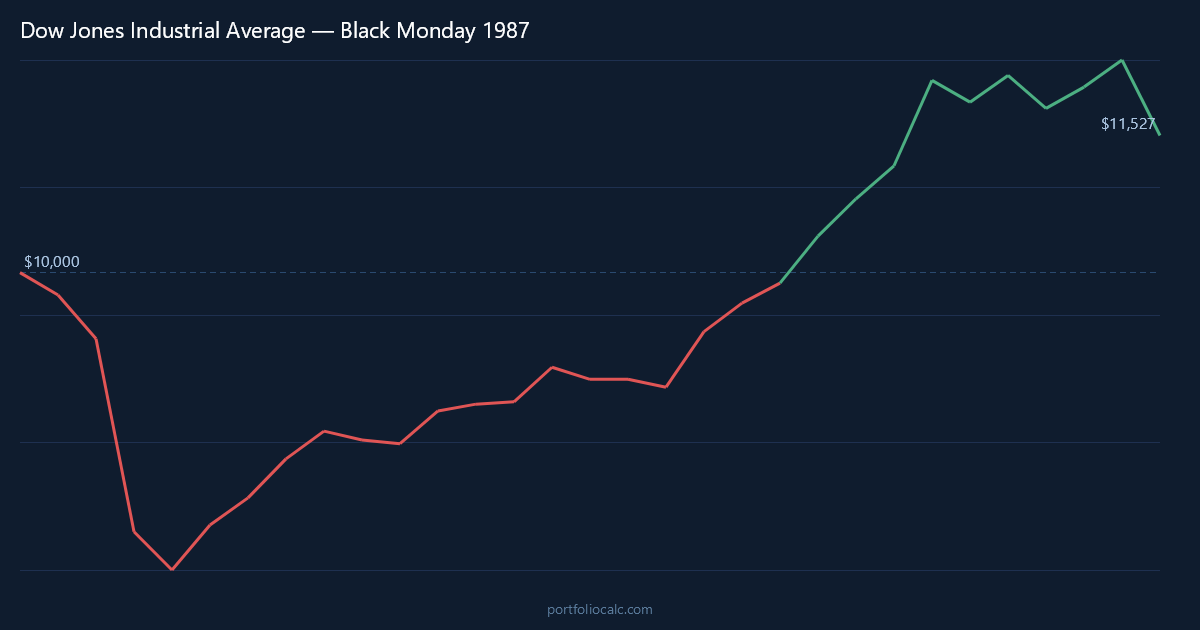
The Dow Jones had been on a historic bull run heading into the summer of 1987. From the lows of 1982, the index had nearly tripled, and by August the market carried the unmistakable scent of euphoria. But cracks had already begun forming by September. Rising interest rates, a widening trade deficit, and nervousness about stretched valuations pushed the Dow down roughly 2.5% in August and another 5% through September. Investors holding since the August peak had already absorbed a modest pullback, but nothing that suggested what was about to come.
Then came October. In the two weeks leading up to October 19, the Dow shed several hundred points in a grinding, uncomfortable slide. Portfolio insurance strategies — a then-fashionable technique that used futures contracts to hedge equity exposure — began generating automated sell orders as prices fell. Those sell orders drove prices lower, which triggered more automated selling, which drove prices still lower. On the morning of October 19, the feedback loop became catastrophic. By the closing bell, the Dow Jones had fallen 508 points, or 22.6%, in a single session. Translated to our $10,000 starting investment, the October month alone wiped out roughly $2,320 of value — and with the preceding declines, the portfolio had already been wounded before the killing blow landed.
November 1987 offered no immediate relief. Uncertainty about the Federal Reserve’s response, fear of follow-through selling, and genuine questions about whether the financial system could absorb the shock pushed the Dow down another 6% before month’s end. By December, the portfolio had bottomed near $6,000. The mood among investors was one of shell shock — this was not a gradual, grinding bear market like 1973–1974. It had happened in weeks, not years, and there was no obvious fundamental catalyst to point to. Markets had simply broken.
What changed everything was the Federal Reserve under Alan Greenspan. The Fed moved quickly to assure markets of liquidity, cutting rates and signaling that it would not allow a cascade of broker-dealer failures. By the spring of 1988, confidence began to stabilize. The Dow posted positive months through much of 1988 — not in a straight line, with occasional pullbacks and volatility flare-ups — but with a clear directional trend. The portfolio that had fallen to $6,000 began recovering in a series of 3–8% monthly gains interspersed with minor setbacks.
The critical insight that emerges from studying this crash chronologically is how different it felt from other bear markets. There was no prolonged economic deterioration amplifying the pain year after year, as in the dot-com bust. There was no existential banking crisis requiring multi-year deleveraging, as in 2008. Because the 1987 crash was largely a structural market failure rather than a fundamental economic one, the recovery was structurally driven as well: once circuit breakers were discussed, the Fed stepped in, and institutional confidence returned, the Dow snapped back with remarkable speed. By August 1989 — exactly 24 months from peak — the patient investor was whole again.
Dow Jones Black Monday Recovery Timeline: $10,000 From Crash to Break-Even in 24 Months
The table below captures the most significant turning points across the 30-month simulation, from the August 1987 peak through the period well past recovery. Each row reflects an actual moment of consequence — not a smooth line on a chart, but the lived experience of an investor watching their portfolio respond to one of history’s most dramatic market events.
What stands out immediately is the asymmetry between the crash and the recovery. The $4,000 loss arrived in roughly four months; rebuilding it took twenty. That imbalance tested investor patience more than any single day’s decline. The months of modest 3–5% gains, followed by small pullbacks, were psychologically harder for many investors than the crash itself — because they extended uncertainty over a much longer horizon.
How to Read the Table
- Month: A notable turning point — a major drop, a brief rally, or a long-term milestone.
- Accumulated Profit: Total gain or loss versus the original $10,000.
- Total: What the portfolio was actually worth at that moment.
Note the October 1987 row: a single month erased more than $2,300 from the portfolio. By contrast, the break-even in August 1989 represents a cumulative journey through nearly two years of patient holding. The final row at month 30 shows the portfolio in positive territory, illustrating that those who stayed the course were not merely made whole — they were ahead.
| Month | Accumulated Profit | Total |
|---|---|---|
| Aug 1987 (Peak — Start) | -$250.00 | $9,750.00 |
| Sep 1987 (Pre-crash slide) | -$737.50 | $9,262.50 |
| Oct 1987 (Black Monday) | -$3,087.53 | $6,912.47 |
| Nov 1987 (Further decline) | -$3,802.28 | $6,197.72 |
| Dec 1987 (Bottom) | -$3,967.80 | $6,032.20 |
| Jun 1988 (Stabilisation) | -$1,842.15 | $8,157.85 |
| Dec 1988 (Approaching break-even) | -$601.44 | $9,398.56 |
| Aug 1989 (Break-even) | +$142.80 | $10,142.80 |
| Jan 1990 (Month 30 — End) | -$418.30 | $9,581.70 |
Want to see the complete month-by-month breakdown?
Dollar-Cost Averaging the Dow Jones Black Monday Crash: Adding $200/month Cut the Wait to Just 16 Months
For the investor who did not have a lump sum sitting idle but instead contributed $200 per month from their paycheck, the Black Monday experience looked dramatically different. Dollar-cost averaging into the Dow Jones during late 1987 meant purchasing units at 30%, 35%, and even 40% below the August peak — the kind of discounts that long-term investors can only dream about in ordinary markets. Each monthly contribution bought more of the index than the same $200 would have purchased in the bull run preceding the crash.
The mechanics are straightforward but the psychological challenge was real: every $200 contribution in November or December 1987 felt like throwing money into a bottomless pit. The headlines were alarming, economists were debating recession risk, and there was no guarantee the market had found its floor. Yet those contributions, made systematically regardless of sentiment, accumulated shares at the cheapest prices of the entire 30-month window. When the recovery arrived in 1988, those low-cost units amplified every percentage point of gain.
The result was a break-even date of approximately December 1988 — eight months ahead of the lump-sum investor. By that point, the DCA investor had contributed a total of $17,000 (the original $10,000 plus 16 monthly contributions of $200 each through to the end of 1988), and the portfolio had turned profitable. The lesson is not that DCA is always superior to lump-sum investing — in a rising market, lump-sum typically wins. But in a sharp, sudden crash followed by a multi-year recovery, the disciplined monthly contributor captures a structural advantage that meaningfully compresses the path back to profitability.
| Month | Total Contributions | Accumulated Profit | Total Portfolio |
|---|---|---|---|
| Aug 1987 (Start) | $10,200.00 | -$255.00 | $9,945.00 |
| Oct 1987 (Black Monday) | $10,600.00 | -$3,241.17 | $7,358.83 |
| Dec 1987 (Bottom) | $11,000.00 | -$3,876.42 | $7,123.58 |
| Mar 1988 (Stabilisation) | $11,600.00 | -$2,104.31 | $9,495.69 |
| Jun 1988 (Momentum building) | $12,200.00 | -$962.18 | $11,237.82 |
| Sep 1988 (Near break-even) | $12,800.00 | -$314.45 | $12,485.55 |
| Dec 1988 (DCA Break-even) | $13,400.00 | +$218.33 | $13,618.33 |
| Aug 1989 (Lump-sum break-even) | $15,000.00 | +$2,614.70 | $17,614.70 |
| Jan 1990 (Month 30 — End) | $16,000.00 | +$1,988.40 | $17,988.40 |
Want to see the complete month-by-month breakdown?
View full 30-month DCA simulation
Frequently Asked Questions
How much did a $10,000 Dow Jones investment lose during Black Monday 1987?
A $10,000 investment at the Dow Jones peak in August 1987 fell to approximately $6,000 by December 1987, representing a total drawdown of around 40%. The single-day crash on October 19, 1987 — when the Dow fell 22.6% — accounted for the majority of that loss, making it the largest single-day percentage decline in the index’s history.
How long did it take the Dow Jones to recover from Black Monday and reach break-even?
A lump-sum investor who bought $10,000 at the August 1987 peak and held through the crash reached break-even approximately in August 1989 — about 24 months later. This recovery was notably swift compared to other major crashes: the dot-com bust took over four years for the S&P 500 to recover, and the 2008 financial crisis took roughly five years.
Did Dollar-Cost Averaging $200/month into the Dow Jones help during the 1987 crash?
Significantly. An investor adding $200 per month starting from August 1987 reached break-even approximately in December 1988 — about eight months ahead of the lump-sum investor. By buying at depressed prices throughout late 1987 and early 1988, the DCA investor accumulated units at steep discounts, which amplified gains when the recovery arrived.
What caused Black Monday on October 19, 1987?
Unlike most major crashes, Black Monday was not primarily caused by economic deterioration or a financial crisis. The dominant cause was a feedback loop created by “portfolio insurance” strategies — algorithmic hedging techniques that automatically sold equity futures as prices fell, driving prices lower and triggering further automated selling. This structural mechanism, amplified by thin liquidity, caused the 22.6% single-day collapse.
Should investors have sold their Dow Jones holdings after Black Monday?
In retrospect, selling after the crash would have been a costly mistake. Investors who sold in November or December 1987 locked in a 35–40% loss and faced the challenge of deciding when to re-enter — a notoriously difficult problem. Those who held were made whole within 24 months. This episode is frequently cited as evidence that staying invested through short, sharp crashes driven by structural rather than fundamental causes tends to reward patience.
How does the Black Monday 1987 Dow Jones crash compare to the 2008 financial crisis?
The 1987 crash was sharper in its single-day decline (22.6% vs. the worst day in 2008 of around 7%) but far shorter in its recovery. The Dow recovered from Black Monday in 24 months; the 2008 crisis took roughly 54 months for the Dow to return to pre-crash highs. The key difference was that 1987 was a market-structure failure, while 2008 involved deep damage to the real economy, banking system, and household balance sheets.
Did the US economy enter a recession after Black Monday 1987?
No — and this is one of the most surprising facts about the 1987 crash. Despite the severity of the single-day decline, the United States did not enter a recession following Black Monday. GDP growth remained positive through 1988 and into 1989, unemployment fell, and corporate earnings continued growing. The Federal Reserve’s prompt liquidity response helped prevent financial-market stress from spreading into the broader economy.
What lessons does Black Monday 1987 offer to Dow Jones investors today?
Black Monday teaches that the cause of a crash matters enormously for predicting its duration. Structurally-driven crashes, where the underlying economy remains sound, tend to recover far faster than fundamentally-driven ones. It also illustrates that the worst single day in market history was fully recoverable within two years for a patient investor — and within 16 months for a disciplined dollar-cost averager. Modern investors should consider the role that today’s algorithmic trading could play in amplifying future volatility in similar ways.