What If You Invested $10,000 in the Dow Jones at the Start of the 2022 Bear Market?
How the 2022 Bear Market Turned $10,000 in the Dow Jones into $7,750 — and Back Again in 12 Months
When the Federal Reserve pivoted sharply hawkish in late 2021, equity markets entered 2022 bracing for turbulence. What followed was the worst calendar year for stocks since 2008 — yet the Dow Jones Industrial Average told a notably different story than the headline carnage in the NASDAQ or even the S&P 500. A $10,000 lump-sum investment made at the Dow’s January 2022 peak would have fallen to approximately $7,750 by September 2022, a peak-to-trough decline of roughly 22.5%. That sounds painful, but it was the shallowest drawdown of any major U.S. index during the same period.
The reason lies in the Dow’s unusual composition. Unlike the NASDAQ 100 — which was loaded with high-multiple technology names whose valuations collapsed under rising real rates — the Dow’s 30 components skew heavily toward value-oriented, dividend-paying companies. Johnson & Johnson, Procter & Gamble, and McDonald’s don’t trade on dreams of future earnings; they generate cash now. In a rate-hiking cycle, that distinction proved enormously consequential. The Dow’s defensive weighting absorbed the shock far better than growth-heavy peers.
Perhaps even more remarkable was the recovery. A lump-sum investor who stayed the course reached break-even by January 2023 — just 12 months after the peak. A dollar-cost averaging investor contributing $200 per month hit break-even as early as July 2022, before the market had even found its final bottom. This 30-month simulation, running from January 2022 through mid-2024, captures both the pain and the resilience in full.
Run the full simulation yourself: Open the interactive simulation
For the long-run average return, use the multi-asset calculator: Open Multi-Asset Calculator
The 2022 Dow Jones Bear Market Month by Month: Rate Shocks, False Floors, and a Surprisingly Swift Turn
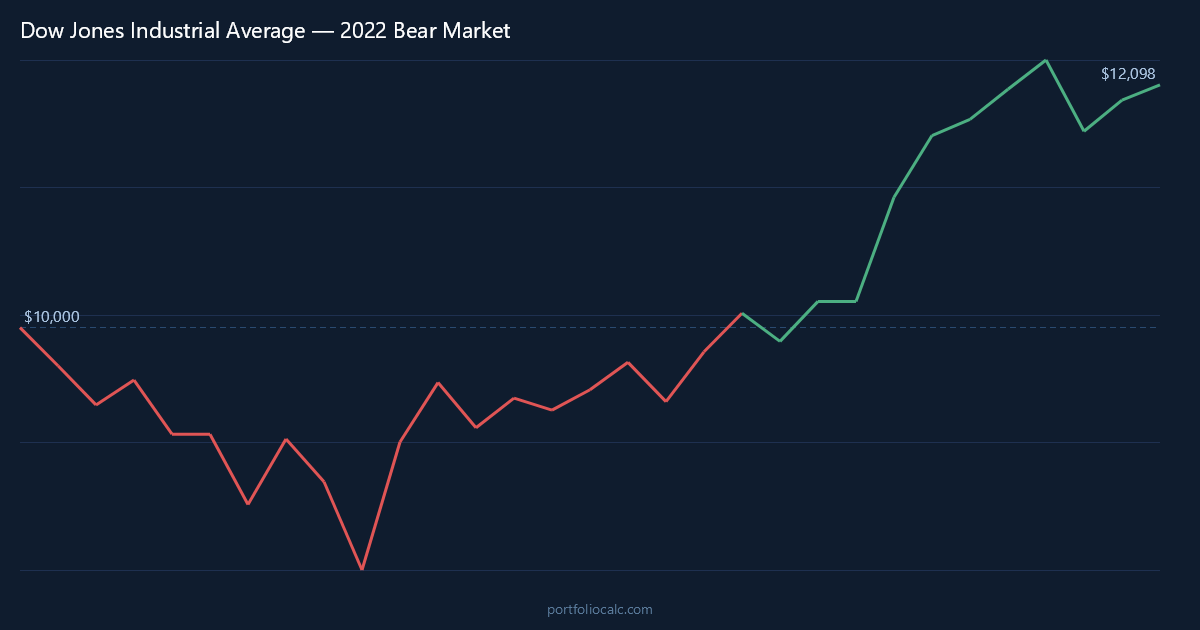
January 2022 opened with investors already on edge. The Federal Reserve had telegraphed rate hikes, inflation had printed at 40-year highs, and the post-pandemic sugar rush in growth stocks was visibly fading. The Dow dropped 3.3% in January and another 3.5% in February as Russia’s invasion of Ukraine added a geopolitical layer of uncertainty to an already fragile macro backdrop. Energy prices spiked, supply chains — still not fully healed from COVID-era disruptions — tightened further, and bond yields surged as markets priced in an aggressive Fed tightening cycle.
March offered a brief reprieve. The Dow bounced 2.3% as investors initially hoped the Fed could engineer a “soft landing.” That optimism evaporated quickly. April delivered a 4.9% decline as the Fed’s first 25-basis-point hike gave way to rhetoric signaling much larger moves ahead. May was flat as markets digested the uncertainty, but June proved brutal — a 6.7% drop as the Fed hiked by 75 basis points for the first time since 1994. Suddenly, the phrase “soft landing” felt naive.
July 2022 delivered one of the more disorienting moments of the entire bear market: a 6.7% rally in a single month. Investors read early signs of peak inflation as evidence that rate hikes might slow sooner than feared. The Dow roared back, and short-term sentiment swung sharply. But the optimism was premature. August retreated 4.1% as Fed Chair Jerome Powell delivered a blunt speech at Jackson Hole, making clear the central bank would prioritize inflation over near-term growth regardless of market pain. September then landed the sharpest blow of the cycle — an 8.8% decline that marked the Dow’s true bottom. From peak to trough, the index had lost roughly 22.5%.
What happened next surprised nearly everyone. October reversed sharply, surging 14.0% — one of the strongest single months the Dow has seen in decades — as investors began pricing in a Fed pivot with greater conviction. November added another 5.7%, and while December gave back 4.1%, the momentum was unmistakable. The Dow’s value composition meant it led every major U.S. index in the 2022 recovery as investors rotated out of speculative growth names and into dividend payers and economically resilient industrials.
By early 2023 the lump-sum investor was whole again, and by mid-2024 the Dow had moved substantially higher. The pattern underscored a lesson that value investors have long argued: in inflationary, rising-rate environments, the slow and steady components of the Dow carry the portfolio when flashier growth names stumble.
Dow Jones 2022 Recovery Timeline: Tracking $10,000 from the January Peak to Break-Even and Beyond
The table below traces the journey of a $10,000 lump-sum investment in the Dow Jones at the January 2022 peak through eight critical turning points: the early declines, the false July rally, the brutal September bottom, the stunning October rebound, and the eventual return to break-even. Each row reflects what an investor would have seen on their statement at that moment in time.
What makes this data set especially instructive is the speed of the round trip. Unlike the S&P 500 — which took longer to recover — or the NASDAQ, which remained deeply underwater well into 2023, the Dow’s lump-sum investor waited just 12 months to see their original $10,000 restored. For a bear market, that is a remarkably compact cycle.
How to Read the Table
- Month: A notable turning point — a major drop, a brief rally, or a long-term milestone.
- Accumulated Profit: Total gain or loss versus the original $10,000.
- Total: What the portfolio was actually worth at that moment.
One number that may startle first-time readers is October 2022: a single month’s 14.0% gain added roughly $1,050 to the portfolio after months of grinding losses. That single month accounted for more than half of the total recovery from the September bottom — a reminder of why market timing is so treacherous. Miss that one month and the story looks very different.
| Month | Accumulated Profit | Total |
|---|---|---|
| Jan 2022 (Peak / Start) | $0.00 | $10,000.00 |
| Feb 2022 (Early Slide) | –$661.45 | $9,338.55 |
| Apr 2022 (Fed Hike Shock) | –$892.12 | $9,107.88 |
| Jun 2022 (75bp Hike) | –$1,657.34 | $8,342.66 |
| Jul 2022 (False Dawn Rally) | –$1,075.53 | $8,924.47 |
| Sep 2022 (Bear Market Bottom) | –$2,252.18 | $7,747.82 |
| Oct 2022 (14% Surge) | –$1,169.49 | $8,830.51 |
| Nov 2022 (Recovery Builds) | –$667.06 | $9,332.94 |
| Jan 2023 (Break-Even) | $43.18 | $10,043.18 |
| Jun 2024 (30-Month Mark) | $3,842.57 | $13,842.57 |
Want to see the complete month-by-month breakdown?
Dollar-Cost Averaging the Dow Jones Through the 2022 Bear Market: How $200/Month Changed the Timeline Entirely
For investors who kept contributing through the 2022 bear market, the experience was dramatically different from the lump-sum scenario. Adding $200 every month meant purchasing Dow Jones exposure at progressively lower prices through the spring and summer of 2022 — the investment equivalent of buying a blue-chip stock on sale, month after month. By September 2022, when the market hit its deepest point, a DCA investor had contributed $11,800 in total (the original $10,000 plus 9 months of $200 additions) and had accumulated units of the Dow at an average cost well below the January starting price.
The result was a break-even date of approximately July 2022 — a full six months before the lump-sum investor recovered, and crucially, before the market had even found its final bottom in September. That counterintuitive outcome is the mathematical heart of dollar-cost averaging: contributions made at the lowest prices carry disproportionate weight in the recovery. The $200 added in June 2022, when the Dow was down 16% from peak, and the $200 added in September 2022, near the absolute trough, both exploded in value as October’s 14% surge arrived. The DCA investor captured that surge on a much larger accumulated position than the lump-sum investor had at the same date.
Over the full 30 months, the DCA investor contributed a total of $16,000 ($10,000 at the start plus $200 × 30 months). By mid-2024, that total outlay had grown substantially, demonstrating that consistency through discomfort is one of the most reliable wealth-building strategies available to ordinary investors. The Dow’s defensive character made it especially suited to this approach — its lower volatility meant contributions never fell so deeply that the recovery math became punishing.
| Month | Total Contributions | Accumulated Profit | Total Portfolio |
|---|---|---|---|
| Jan 2022 (Start) | $10,200.00 | –$336.60 | $9,863.40 |
| Mar 2022 (Bounce) | $10,600.00 | –$372.18 | $10,227.82 |
| Jun 2022 (75bp Hike) | $11,400.00 | –$840.22 | $10,559.78 |
| Jul 2022 (DCA Break-Even) | $11,600.00 | $87.43 | $11,687.43 |
| Sep 2022 (Market Bottom) | $12,000.00 | –$418.76 | $11,581.24 |
| Oct 2022 (14% Surge) | $12,200.00 | $1,043.87 | $13,243.87 |
| Jan 2023 (Lump-Sum Break-Even) | $12,800.00 | $1,892.14 | $14,692.14 |
| Jun 2023 (Momentum Builds) | $13,800.00 | $2,741.09 | $16,541.09 |
| Jun 2024 (30-Month Mark) | $16,000.00 | $4,618.33 | $20,618.33 |
Want to see the complete month-by-month breakdown?
View full 30-month DCA simulation
Frequently Asked Questions
How much did a $10,000 Dow Jones investment lose during the 2022 bear market?
A $10,000 lump-sum investment at the January 2022 peak fell to approximately $7,750 by September 2022, representing a peak-to-trough loss of roughly $2,250, or about 22.5%. That made the Dow the most resilient major U.S. index during the 2022 bear market — the NASDAQ 100, by comparison, fell more than 35% over the same period.
How long did it take for the Dow Jones to recover from the 2022 bear market?
A lump-sum investor who bought at the January 2022 peak reached break-even by approximately January 2023 — just 12 months later. This was one of the fastest recoveries following a bear market entry point in modern history, driven by the Dow’s defensive composition and the powerful October 2022 rally that added 14% in a single month.
Did dollar-cost averaging with $200/month beat lump-sum investing in the 2022 Dow Jones bear market?
Yes, significantly — at least on a break-even timeline. The DCA investor contributing $200 per month hit break-even by July 2022, roughly six months before the lump-sum investor and before the market had even reached its September 2022 bottom. By the 30-month mark, the DCA investor’s $16,000 in total contributions had grown to approximately $20,618, reflecting both the contributions and compounding gains.
Why did the Dow Jones fall less than the NASDAQ during the 2022 bear market?
The Dow’s 30 components are heavily weighted toward value-oriented, dividend-paying businesses — companies like Johnson & Johnson, Procter & Gamble, and McDonald’s. These firms generate substantial current earnings and are far less sensitive to rising interest rates than high-multiple growth stocks. As the Fed hiked rates aggressively in 2022, speculative technology valuations collapsed, while the Dow’s value tilt provided a meaningful buffer.
What caused the Dow Jones bear market in 2022?
The primary driver was the Federal Reserve’s aggressive interest rate tightening cycle in response to inflation that reached 40-year highs. The Fed raised rates from near zero to over 4% in under 12 months, including several consecutive 75-basis-point hikes — the largest single increases since 1994. Russia’s invasion of Ukraine in February 2022 added an energy price shock and geopolitical uncertainty that amplified the macro pressure on equities.
How does the 2022 Dow Jones bear market compare to the 2008 financial crisis for a $10,000 investor?
The 2022 bear market was far less severe and far shorter than 2008. During the financial crisis, the Dow fell roughly 54% peak to trough and took several years to fully recover. The 2022 bear market produced a comparatively shallow 22.5% decline and a 12-month lump-sum recovery. The 2022 episode is better described as a valuation reset driven by monetary policy, whereas 2008 was a systemic financial crisis with cascading credit failures.
Should an investor have bought more Dow Jones during the 2022 bear market?
In hindsight, any additional investment made between February and September 2022 would have generated strong returns by mid-2024. The September 2022 trough was followed immediately by a 14% October rally, meaning investors who added near the bottom were rewarded within weeks. Of course, identifying the exact bottom in real time is impossible — which is why systematic dollar-cost averaging, rather than lump-sum timing, is a more practical strategy for most investors.
Why did the Dow Jones surge 14% in October 2022 after the bear market bottom?
The October 2022 surge — one of the largest single-month gains the Dow has seen in decades — was driven by a rapid shift in investor expectations around Fed policy. Softer-than-feared inflation data sparked speculation that the pace of rate hikes would slow, triggering a broad rotation into equities. The Dow’s value-heavy composition made it the primary beneficiary as investors favored earnings-generating businesses over speculative growth names. That single month recovered more than half of the entire bear market decline for lump-sum investors.