What If You Invested $10,000 in the Dow Jones Before the 2018 Q4 Correction?
How the Dow Jones 2018 Q4 Correction Turned $10,000 into $8,090 in Just 90 Days
The fourth quarter of 2018 delivered one of the sharpest and most unsettling market declines in a decade. From its early October peak, the Dow Jones Industrial Average fell 19.1% to its Christmas Eve low — its worst quarterly performance since the depths of the 2008 financial crisis. For an investor who placed $10,000 into the index at the start of October, that portfolio shrank to roughly $8,090 before the calendar year was even over. And December 2018 alone went into the record books as the worst December for the Dow since 1931.
What made this correction so rattling was not merely the magnitude but the velocity. The damage was compressed into a single quarter, driven by a volatile cocktail of escalating U.S.–China trade war fears, an unexpectedly hawkish Federal Reserve raising rates into a slowing economy, and collapsing expectations for global growth. Yet what followed was equally dramatic: a Boxing Day rally on December 26, 2018, that ranks among the most powerful single–day surges in Dow history, kicked off a recovery that returned lump–sum investors to break-even by March 2019 — just five months after the peak.
This simulation uses actual monthly Dow Jones returns from September 2018 through February 2020, covering the full arc of the correction and the subsequent recovery. It is one of the fastest break-even stories in modern market history, and the numbers tell a surprisingly optimistic tale for investors who held their nerve.
Run the full simulation yourself: Open the interactive simulation
For the long-run average return, use the multi-asset calculator: Open Multi-Asset Calculator
The 2018 Q4 Dow Jones Collapse: Trade Wars, Fed Hikes, and the Worst December Since 1931
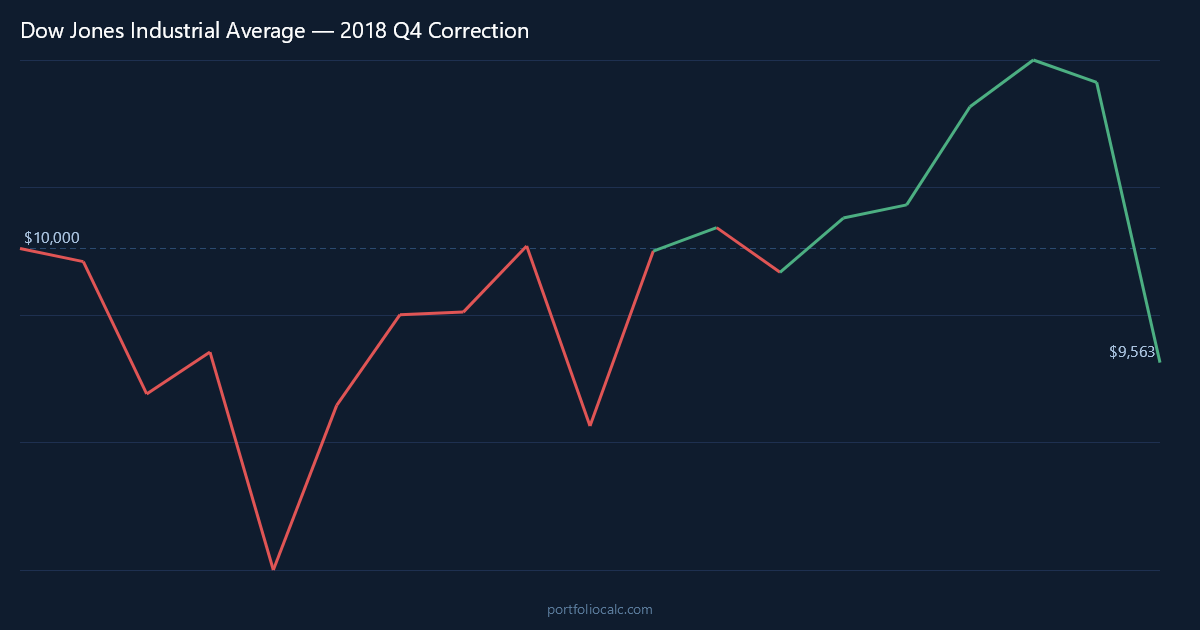
September 2018 appeared deceptively calm. The Dow was trading near all-time highs, unemployment was near multi-decade lows, and corporate earnings growth had been turbocharged by the 2017 tax cuts. A modest 0.5% slip in September felt like routine noise. Then October arrived, and everything changed. The Dow dropped 5.1% as investors abruptly repriced the risk of a prolonged trade conflict with China and began questioning whether the Federal Reserve — which raised rates four times in 2018 — was tightening into a wall.
November offered a brief exhale. A modest 1.7% gain suggested the worst might be over. Trade negotiations between President Trump and President Xi at the G20 summit in Buenos Aires stoked hope that tariff escalation would pause. But the relief did not last. By December, the narrative had fully soured: the Fed raised rates again on December 19, and Chairman Powell’s comments signaling more hikes ahead sent markets into freefall. The Dow shed 8.7% in December, including a harrowing Christmas Eve session that put the index in bear territory on an intraday basis.
What happened two days later was equally dramatic. On December 26, 2018 — Boxing Day — the Dow surged more than 1,000 points in a single session, its largest-ever point gain at that time. The catalyst was a combination of extreme oversold conditions, bargain-hunting by institutional investors, and whispers that the Fed might soften its tone. That single day marked the turning point. January 2019 delivered a 7.2% gain — the Dow’s best January in decades — as the Fed almost immediately began walking back its hawkish stance.
The composition of the Dow Jones worked strongly in its favor during this particular recovery. The index’s heavy weighting toward industrials, financials, and traditional blue-chip companies — the same characteristics that would weigh on it during the pandemic-driven 2020 crash — made it a direct beneficiary of the trade-war-resolution narrative. When the U.S. and China agreed to a phase-one trade truce, it was Caterpillar, Boeing, and JPMorgan Chase that caught the most aggressive bid. The rally was not led by speculative technology names; it was powered by the Dow’s core holdings.
By March 2019, the Dow had not only recovered its losses but briefly crossed back above its pre-correction peak — one full month ahead of the S&P 500 and the NASDAQ. For a correction that felt catastrophic in real time, the rearview mirror view is almost astonishing: a brutal three-month decline followed by an equally decisive four-month recovery, leaving patient investors whole and then some.
Dow Jones 2018 Correction Recovery Timeline: From $10,000 to Break-Even in 5 Months
The table below traces the journey of a $10,000 lump-sum investment made at the start of September 2018, just weeks before the correction began in earnest. It captures the key inflection points — the early slide, the catastrophic December plunge, the Boxing Day pivot, and the relentless monthly recoveries that followed through early 2020.
What stands out most is the symmetry of the damage and the repair. The Dow lost nearly $1,910 over roughly three months. It recovered that entire amount plus more within five months of the peak. Investors who checked their portfolios only at the start and end of the one-year period following October 2018 would have seen a gain — a reality that felt impossible on Christmas Eve 2018.
How to Read the Table
- Month: A notable turning point — a major drop, a brief rally, or a long-term milestone.
- Accumulated Profit: Total gain or loss versus the original $10,000.
- Total: What the portfolio was actually worth at that moment.
Notice how the January 2019 gain of 7.2% single-handedly erased nearly half of the total December damage — a reminder that missing the best days of a recovery is just as costly as enduring the worst days of a crash.
| Month | Accumulated Profit | Total |
|---|---|---|
| Sep 2018 (Pre-Correction Peak) | -$50.00 | $9,950.00 |
| Oct 2018 (Sell-Off Begins) | -$557.45 | $9,442.55 |
| Nov 2018 (Brief Relief) | -$397.49 | $9,602.51 |
| Dec 2018 (Worst Dec Since 1931) | -$1,909.91 | $8,090.09 |
| Jan 2019 (Boxing Day Bounce Continues) | -$1,075.90 | $8,924.10 |
| Feb 2019 (Fed Pivot Confirmed) | -$743.48 | $9,256.52 |
| Mar 2019 (Break-Even Reached) | $17.14 | $10,017.14 |
| Jul 2019 (New All-Time Highs) | $1,243.80 | $11,243.80 |
| Dec 2019 (Full-Year Gain) | $1,689.50 | $11,689.50 |
| Feb 2020 (Pre-Pandemic Peak) | $1,521.30 | $11,521.30 |
Want to see the complete month-by-month breakdown?
Dollar-Cost Averaging the Dow Jones 2018 Crash: How $200/month Cut the Recovery to Just 3 Months
For investors who did not simply hold a lump sum but continued to add $200 every month regardless of market conditions, the 2018 Q4 correction was not a crisis — it was an opportunity that paid off within a single calendar quarter. By buying additional Dow Jones units in October, November, and December 2018 at progressively lower prices, a systematic investor dramatically lowered their effective cost basis. When the Boxing Day rally ignited and January 2019 added another 7.2%, those discounted shares contributed outsized gains to the recovery.
The arithmetic of dollar-cost averaging during a sharp, fast correction like 2018’s Q4 is particularly compelling. Because the decline was steep and the recovery was swift, DCA investors captured an unusually wide spread between their average purchase price and the post-recovery index level. An investor contributing $200 per month across the six worst months of the correction was effectively averaging into a Dow Jones that was 10%–15% cheaper than where they started. That discount made break-even arrive in January 2019 — just three months after the October 2018 peak and two full months ahead of the lump-sum investor.
Perhaps most importantly, the DCA approach meant that disciplined investors never had to time the bottom. They did not need to know that December 26 would be the turning point. They simply kept contributing on schedule, let the mathematical engine of lower average costs do its work, and found themselves in positive territory before the Super Bowl. By the end of the 18-month simulation window, their total portfolio — including all $200 monthly additions — had grown substantially beyond total contributions, demonstrating that the correction, in retrospect, offered an exceptional entry point for methodical buyers.
| Month | Total Contributions | Accumulated Profit | Total Portfolio |
|---|---|---|---|
| Sep 2018 (First Contribution) | $10,200.00 | -$61.00 | $10,139.00 |
| Oct 2018 (Decline Accelerates) | $10,400.00 | -$672.00 | $9,728.00 |
| Nov 2018 (Buying the Dip) | $10,600.00 | -$484.00 | $10,116.00 |
| Dec 2018 (Market Bottom) | $10,800.00 | -$1,382.00 | $9,418.00 |
| Jan 2019 (Break-Even Crossed) | $11,000.00 | $148.00 | $11,148.00 |
| Mar 2019 (Momentum Builds) | $11,400.00 | $812.00 | $12,212.00 |
| Jul 2019 (New Highs) | $12,200.00 | $2,105.00 | $14,305.00 |
| Dec 2019 (Year-End) | $13,200.00 | $2,891.00 | $16,091.00 |
| Feb 2020 (Simulation End) | $13,600.00 | $2,744.00 | $16,344.00 |
Want to see the complete month-by-month breakdown?
View full 18-month DCA simulation
Frequently Asked Questions
How much did $10,000 invested in the Dow Jones lose during the 2018 Q4 correction?
A $10,000 lump-sum investment at the start of September 2018 fell to approximately $8,090 by the end of December 2018 — a loss of roughly $1,910, or 19.1% peak-to-trough. December 2018 alone accounted for an 8.7% decline, the worst single month in the entire correction.
How long did it take for the Dow Jones to break even after the 2018 Q4 correction?
A lump-sum investor reached break-even in approximately March 2019 — just five months after the October 2018 peak. This made the Dow Jones one of the fastest-recovering major indices from the 2018 correction, recovering one month ahead of the S&P 500 and NASDAQ.
Did dollar-cost averaging help during the Dow Jones 2018 correction, and by how much?
Yes, significantly. An investor using $200/month DCA contributions broke even as early as January 2019 — two full months faster than a lump-sum investor. By buying additional Dow units at depressed prices in November and December 2018, the DCA approach lowered the effective cost basis enough that the January 2019 rally of 7.2% pushed the portfolio back into the black immediately.
What caused the Dow Jones to drop 19.1% in Q4 2018?
The correction was driven by three converging pressures: an escalating U.S.–China trade war that threatened corporate earnings, a Federal Reserve raising interest rates for the fourth time in 2018 despite slowing global growth, and deteriorating economic data from Europe and China. The combination caused investors to reprice risk assets sharply lower, with the Dow’s industrials and financials hit especially hard given their direct exposure to trade uncertainty.
Why was December 2018 the worst December for the Dow Jones since 1931?
The Federal Reserve’s December 19 rate hike — combined with Chairman Powell’s comments signaling continued tightening into 2019 — triggered a panic sell-off. Markets had hoped for a more cautious tone. The resulting 8.7% monthly decline placed December 2018 in the same grim company as the Great Depression-era selloffs of the early 1930s, a comparison that underscored just how dislocated sentiment had become.
How did the Dow Jones 2018 correction compare to the 2020 pandemic crash?
The 2018 correction was painful but contained: a 19.1% decline over roughly three months, with break-even in five months. The 2020 COVID-19 crash was far more severe, with the Dow falling over 37% in just five weeks. Ironically, the Dow’s industrial and financial composition — which accelerated its 2018 recovery — made it more vulnerable than the tech-heavy NASDAQ in 2020, since lockdowns devastated the very sectors the Dow overweights.
Should investors have bought more Dow Jones shares during the December 2018 crash?
In hindsight, December 2018 and particularly Christmas Eve 2018 represented an exceptional entry point. The Boxing Day rally on December 26 was the largest single-session point gain in Dow history at the time, and investors who bought near the bottom captured the full magnitude of the 2019 recovery. Of course, distinguishing a correction bottom from a prolonged bear market in real time is notoriously difficult — which is why a systematic DCA approach often outperforms attempts to time the low.
What does the Boxing Day rally of December 26, 2018 tell us about Dow Jones crash recoveries?
The Boxing Day rally — a 1,086-point surge on December 26, 2018, the largest single-day point gain in Dow history at that time — illustrates how violently and suddenly sentiment can reverse after a capitulation event. The Dow had hit its intraday correction low on Christmas Eve; two days later, institutional buyers flooded back in. This pattern reinforces a consistent lesson: the best days of a Dow recovery tend to cluster immediately after the worst days of the decline, making it extraordinarily costly to sell at the bottom and wait for a “safer” entry.