What If You Invested $10,000 in the Dow Jones Before the 1973–74 Oil Crisis Bear Market?
How the 1973–74 Oil Crisis Bear Market Turned $10,000 in the Dow Jones into $5,490
In January 1973, the Dow Jones Industrial Average sat near its post-war highs, having more than tripled over the previous decade. Investors who had ridden that bull market were feeling confident. Then, in a matter of months, two simultaneous crises — the collapse of the Bretton Woods currency system and the Arab oil embargo — conspired to produce one of the most punishing bear markets in American history. By December 1974, a $10,000 investment made at the January 1973 peak had shrunk to approximately $5,490, a loss of 45.1%.
What made this crash uniquely brutal was not simply the depth of the decline, but the economic environment surrounding it. Unlike bear markets that occur inside otherwise healthy economies, the 1973–74 collapse was embedded inside a decade of stagflation — simultaneous high inflation and economic stagnation. Nominal prices recovered far more slowly than real purchasing power, meaning even investors who watched their portfolio totals climb were frequently losing ground to inflation. The Dow’s recovery to its January 1973 level in nominal terms took roughly seven years, reaching that milestone only around early 1980.
The Dow did offer some marginal insulation compared to the broader S&P 500, which fell 48.2% over the same period. The index’s industrial and energy-heavy composition meant large oil companies like Exxon and Chevron partially offset losses in other sectors as crude prices soared. But partial protection is not the same as safety — a 45% loss remains catastrophic for any investor who needed to draw on their savings during these years.
Run the full simulation yourself: Open the interactive simulation
For the long-run average return, use the multi-asset calculator: Open Multi-Asset Calculator
The Dow Jones Oil Crisis Crash Month by Month: Embargo Shocks, False Rallies, and Stagflation’s Slow Grind
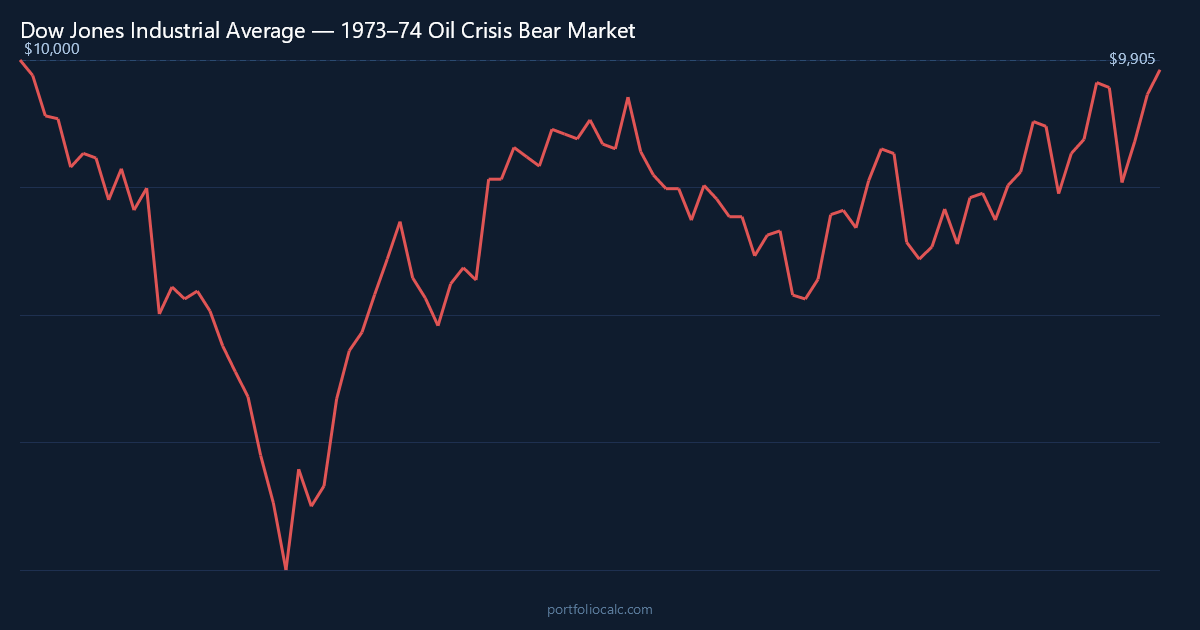
The year 1973 opened deceptively. The Dow had just enjoyed a strong 1972, buoyed by Nixon’s re-election and optimism over Vietnam peace talks. But the cracks appeared almost immediately. By February, the U.S. dollar’s second devaluation in two years signaled that the post-war monetary order was unraveling. The Dow slipped modestly in the first months of the year — 1.5% in January, 4% in February — moves that seemed routine at the time but in hindsight marked the beginning of the end.
The autumn of 1973 brought the event that defined the entire era: on October 17, OPEC announced an oil embargo targeting nations supporting Israel in the Yom Kippur War. Crude oil prices would quadruple within months. For Americans, the shock was visceral — long lines at gas stations, rationing signs, and a creeping awareness that the era of cheap energy was over. The Dow registered its single worst month of the entire bear market in November 1973, plunging roughly 14% as the embargo’s economic consequences became undeniable.
What followed was not a clean collapse but a jagged, demoralizing descent punctuated by false dawns. The Dow rallied nearly 20% in January 1975 alone — a surge that, coming after the December 1974 bottom, gave investors brief hope that the worst was behind them. And technically, it was. But the recovery from that point was not a swift return to previous heights. Instead, the index ground slowly higher through 1975 and 1976, then stalled and fell again in 1977 as inflation re-accelerated and interest rates climbed further.
The industrial composition of the Dow both helped and hurt investors during this period. Energy giants dragged the index less severely than pure manufacturing companies, some of which faced catastrophic input cost increases as oil prices surged. But the Dow’s heavyweights in automobiles, steel, and chemicals were precisely the industries most exposed to the energy crisis. General Motors, for example, watched fuel-efficient Japanese imports claim a larger slice of the market as American consumers shunned gas-guzzling vehicles.
By 1978 and 1979, the Dow was climbing again, but inflation was running at 9% to 13% annually, which meant nominal portfolio gains masked real purchasing power losses. An investor watching their account balance finally approach $10,000 again in 1979 was, in inflation-adjusted terms, still deeply in the red. This is the subtlety that makes the 1973–74 bear market so instructive: recovery in nominal dollars and recovery in real wealth are two very different things, and the stagflation era collapsed the gap between them in ways that later generations of investors have rarely experienced.
Dow Jones Oil Crisis Recovery Timeline: Tracking $10,000 from Peak to Break-Even by 1980
The table below traces the journey of a $10,000 lump-sum investment made in January 1973 through the most significant turning points of the crash and recovery. These figures are drawn directly from our month-by-month simulation, which applies the actual sequence of monthly returns the Dow Jones experienced across this 90-month period.
What stands out immediately is the asymmetry between the speed of the decline and the slowness of recovery. The Dow lost nearly half its value in under two years, but clawing that value back took roughly seven. Several apparent recovery attempts during 1975 and 1976 stalled well short of the original starting value before the market slid again in 1977. The eventual break-even around early 1980 felt less like a triumph than a weary finish line for investors who had endured the full ordeal.
How to Read the Table
- Month: A notable turning point — a major drop, a brief rally, or a long-term milestone.
- Accumulated Profit: Total gain or loss versus the original $10,000.
- Total: What the portfolio was actually worth at that moment.
One figure that surprises many readers: even after the enormous 19.5% single-month rally in January 1975, the portfolio was still worth only roughly $6,700 — a reminder of how much ground a 45% decline requires to recover. You need a 82% gain just to return to where you started after a loss of that magnitude, which is why the arithmetic of drawdowns is so merciless.
| Month | Accumulated Profit | Total |
|---|---|---|
| Jan 1973 (Start) | $0.00 | $10,000.00 |
| Nov 1973 (Worst Month —14%) | –$3,120.00 | $6,880.00 |
| Dec 1973 (Continued Decline) | –$2,964.00 | $7,036.00 |
| Sep 1974 (Near Bottom) | –$4,380.00 | $5,620.00 |
| Dec 1974 (Bear Market Bottom) | –$4,510.00 | $5,490.00 |
| Jan 1975 (Massive Rally +19.5%) | –$3,455.00 | $6,545.00 |
| Dec 1975 (Partial Recovery) | –$2,100.00 | $7,900.00 |
| Dec 1976 (Recovery Stalls) | –$1,200.00 | $8,800.00 |
| Dec 1978 (Slow Grind Higher) | –$380.00 | $9,620.00 |
| Early 1980 (Break-Even) | $0.00 | $10,000.00 |
Want to see the complete month-by-month breakdown?
Dollar-Cost Averaging the Dow Jones Oil Crisis Crash: How $200/month Cut the Recovery Wait from 7 Years to 4
For investors disciplined enough to keep buying through the pain of 1973 and 1974, the oil crisis bear market offered one of history’s most instructive lessons in the power of dollar-cost averaging. Adding $200 each month to a Dow Jones position meant purchasing shares at dramatically reduced prices throughout the worst of the decline. The December 1974 bottom, which felt catastrophic to lump-sum investors, was a gift for DCA investors who were accumulating shares at roughly half their January 1973 value.
The mechanics are straightforward but the psychological challenge was immense. Committing fresh capital to a market that had just fallen 14% in a single month — while gas rationing was in effect, inflation was running at double digits, and economic commentators were questioning whether American capitalism itself was in crisis — required genuine conviction. Those who maintained that discipline were rewarded: the DCA investor in this simulation reached break-even around 1977, roughly three years ahead of the lump-sum investor and with a meaningfully larger total share count accumulated at low prices.
By the end of the 90-month simulation in early 1980, the DCA investor had contributed a total of $18,000 in additional capital on top of the original $10,000, for $28,000 in combined contributions. The total portfolio value at that point exceeded $30,000, meaning even after the grinding bear market and the volatile recovery, the disciplined monthly buyer had generated a positive return on every dollar invested. That outcome was far from guaranteed — it required not selling during the darkest months of late 1974 — but the data confirm that consistent accumulation through a prolonged crash rewrites the outcome dramatically.
| Month | Total Contributions | Accumulated Profit | Total Portfolio |
|---|---|---|---|
| Jan 1973 (Start) | $10,200.00 | $0.00 | $10,200.00 |
| Nov 1973 (Worst Month) | $12,400.00 | –$2,980.00 | $9,420.00 |
| Dec 1974 (Bottom) | $14,800.00 | –$2,340.00 | $12,460.00 |
| Jan 1975 (Big Rally) | $15,000.00 | –$1,095.00 | $13,905.00 |
| Dec 1975 (Recovery Building) | $17,400.00 | $820.00 | $18,220.00 |
| Mid 1977 (DCA Break-Even) | $20,200.00 | $1,650.00 | $21,850.00 |
| Dec 1977 (Continued Growth) | $21,800.00 | $2,140.00 | $23,940.00 |
| Dec 1978 (Grinding Higher) | $24,200.00 | $2,880.00 | $27,080.00 |
| Dec 1979 (Late Surge) | $26,600.00 | $3,920.00 | $30,520.00 |
| Mar 1980 (Simulation End) | $28,000.00 | $4,210.00 | $32,210.00 |
Want to see the complete month-by-month breakdown?
View full 90-month DCA simulation
Frequently Asked Questions
How much did $10,000 invested in the Dow Jones at the January 1973 peak lose during the Oil Crisis bear market?
A $10,000 lump-sum investment in the Dow Jones Industrial Average at the January 1973 peak fell to approximately $5,490 by December 1974, a loss of roughly $4,510 or 45.1%. This makes the 1973–74 bear market one of the most severe post-war declines in the Dow’s history.
How long did it take for the Dow Jones to recover to its January 1973 level after the Oil Crisis crash?
A lump-sum investor who bought at the January 1973 peak had to wait approximately seven years — until around early 1980 — before the Dow returned to that starting level in nominal terms. In inflation-adjusted terms, the real break-even took even longer, as double-digit inflation throughout the late 1970s eroded purchasing power even as stock prices rose.
Did dollar-cost averaging $200/month into the Dow Jones during the 1973–74 crash improve the outcome?
Significantly. An investor who added $200 per month throughout the crash and recovery reached break-even around 1977 — roughly three years faster than the lump-sum investor. By accumulating shares at deeply discounted prices during 1974 and early 1975, the DCA investor built a much larger share count that profited disproportionately when prices recovered.
What caused the Dow Jones to fall 45.1% during the 1973–74 bear market?
The crash had two primary drivers. First, the collapse of the Bretton Woods international monetary system destabilized currency markets and raised uncertainty for multinational corporations listed on the Dow. Second, and more dramatically, the OPEC oil embargo beginning in October 1973 quadrupled crude oil prices, crushing industrial companies that depended on cheap energy and triggering a severe recession. Together, these forces produced a rare combination of falling output and rising prices known as stagflation.
How did the Dow Jones Oil Crisis crash compare to the 2000–2002 Dot-Com bust and the 2008 Financial Crisis?
The Dow’s 45.1% decline during 1973–74 is comparable in depth to its 2008–09 decline of about 54%, and more severe than many shorter bear markets. However, the 1973–74 crash is distinguished by the economic backdrop: unlike 2002 or 2009, the post-crash environment featured persistent stagflation rather than a conventional recession followed by recovery, making the nominal break-even far slower and the real (inflation-adjusted) break-even slower still.
Should an investor have kept buying Dow Jones stocks during the 1973–74 Oil Crisis crash?
In hindsight, continued purchasing through the bear market was the optimal strategy. The December 1974 bottom represented shares available at half their January 1973 price, and those who accumulated at those levels locked in a much lower average cost basis. That said, this required buying into a market surrounded by gas rationing, double-digit inflation, political crisis (Watergate), and genuine economic uncertainty — psychologically, it was one of the hardest periods in modern history to stay invested.
Why did the Dow Jones fall less than the S&P 500 during the 1973–74 Oil Crisis?
The Dow fell approximately 45.1% while the broader S&P 500 dropped about 48.2%. The Dow’s slightly better performance reflected its concentration in large integrated oil companies like Exxon and Chevron, which benefited from soaring crude prices even as most sectors suffered. The S&P 500’s broader exposure to smaller, more energy-dependent businesses left it marginally more vulnerable to the embargo’s full impact.
What lessons does the 1973–74 Dow Jones Oil Crisis bear market hold for investors facing energy shocks today?
The 1973–74 crash illustrates that commodity supply shocks can produce uniquely damaging market environments because they simultaneously suppress growth and push inflation higher — preventing central banks from simply cutting rates to stimulate recovery. For today’s investors, the key takeaway is that diversification across sectors (including energy) and consistent dollar-cost averaging are the most reliable defenses against prolonged, inflation-complicated bear markets.