Financial Portfolio Calculator – Portfolio Growth & Returns
Use this portfolio calculator to estimate long-term investment growth, including compound interest, contributions, and inflation impact.
Quick start:
Rates are based on historical averages and for illustration only. Past performance does not guarantee future results.
Run a finance blog or site? Embed this calculator for free.
Investment Horizon
yr
Press ↵ Enter to applyAnnual Inflation
%
| Asset | Start amount ($) | Monthly Contribution ($) | Annual Contribution ($) | Annual Rate (%) | Profit ($) in 20 Years | Total ($) | |
|---|---|---|---|---|---|---|---|
| $184,726 | $220,726 | ||||||
| $152,565 | $168,565 | ||||||
| 7.50 | $72,923 | $98,923 | |||||
| Total | $60,000 | $0 | $18,000 | $410,214 | $488,214 | ||
Profit
$184,726
Total
$220,726
Profit
$152,565
Total
$168,565
7.50%
Profit
$72,923
Total
$98,923
All assets result
Total Profit:
$410,214
Total Invested (Start amount + Contributions):
$78,000
Total Sum:
$488,214
Portfolio Value Per Year Chart
All Assets Per Year
| Year | Start Amount | Total Contribution | Profit per Year | Accumulated Profit | Total |
|---|---|---|---|---|---|
| 1 | $60,000 | $900 | $5,994 | $5,994 | $66,894 |
| 2 | $66,894 | $1,800 | $6,708 | $12,703 | $74,503 |
| 3 | $74,503 | $2,700 | $7,499 | $20,202 | $82,902 |
| 4 | $82,902 | $3,600 | $8,377 | $28,579 | $92,179 |
| 5 | $92,179 | $4,500 | $9,352 | $37,931 | $102,431 |
| 6 | $102,431 | $5,400 | $10,434 | $48,364 | $113,764 |
| 7 | $113,764 | $6,300 | $11,636 | $60,000 | $126,300 |
| 8 | $126,300 | $7,200 | $12,972 | $72,971 | $140,171 |
| 9 | $140,171 | $8,100 | $14,458 | $87,429 | $155,529 |
| 10 | $155,529 | $9,000 | $16,111 | $103,540 | $172,540 |
| 11 | $172,540 | $9,900 | $17,951 | $121,492 | $191,392 |
| 12 | $191,392 | $10,800 | $20,001 | $141,493 | $212,293 |
| 13 | $212,293 | $11,700 | $22,285 | $163,777 | $235,477 |
| 14 | $235,477 | $12,600 | $24,830 | $188,607 | $261,207 |
| 15 | $261,207 | $13,500 | $27,669 | $216,277 | $289,777 |
| 16 | $289,777 | $14,400 | $30,837 | $247,114 | $321,514 |
| 17 | $321,514 | $15,300 | $34,373 | $281,487 | $356,787 |
| 18 | $356,787 | $16,200 | $38,323 | $319,810 | $396,010 |
| 19 | $396,010 | $17,100 | $42,736 | $362,545 | $439,645 |
| 20 | $439,645 | $18,000 | $47,669 | $410,214 | $488,214 |
Related Articles
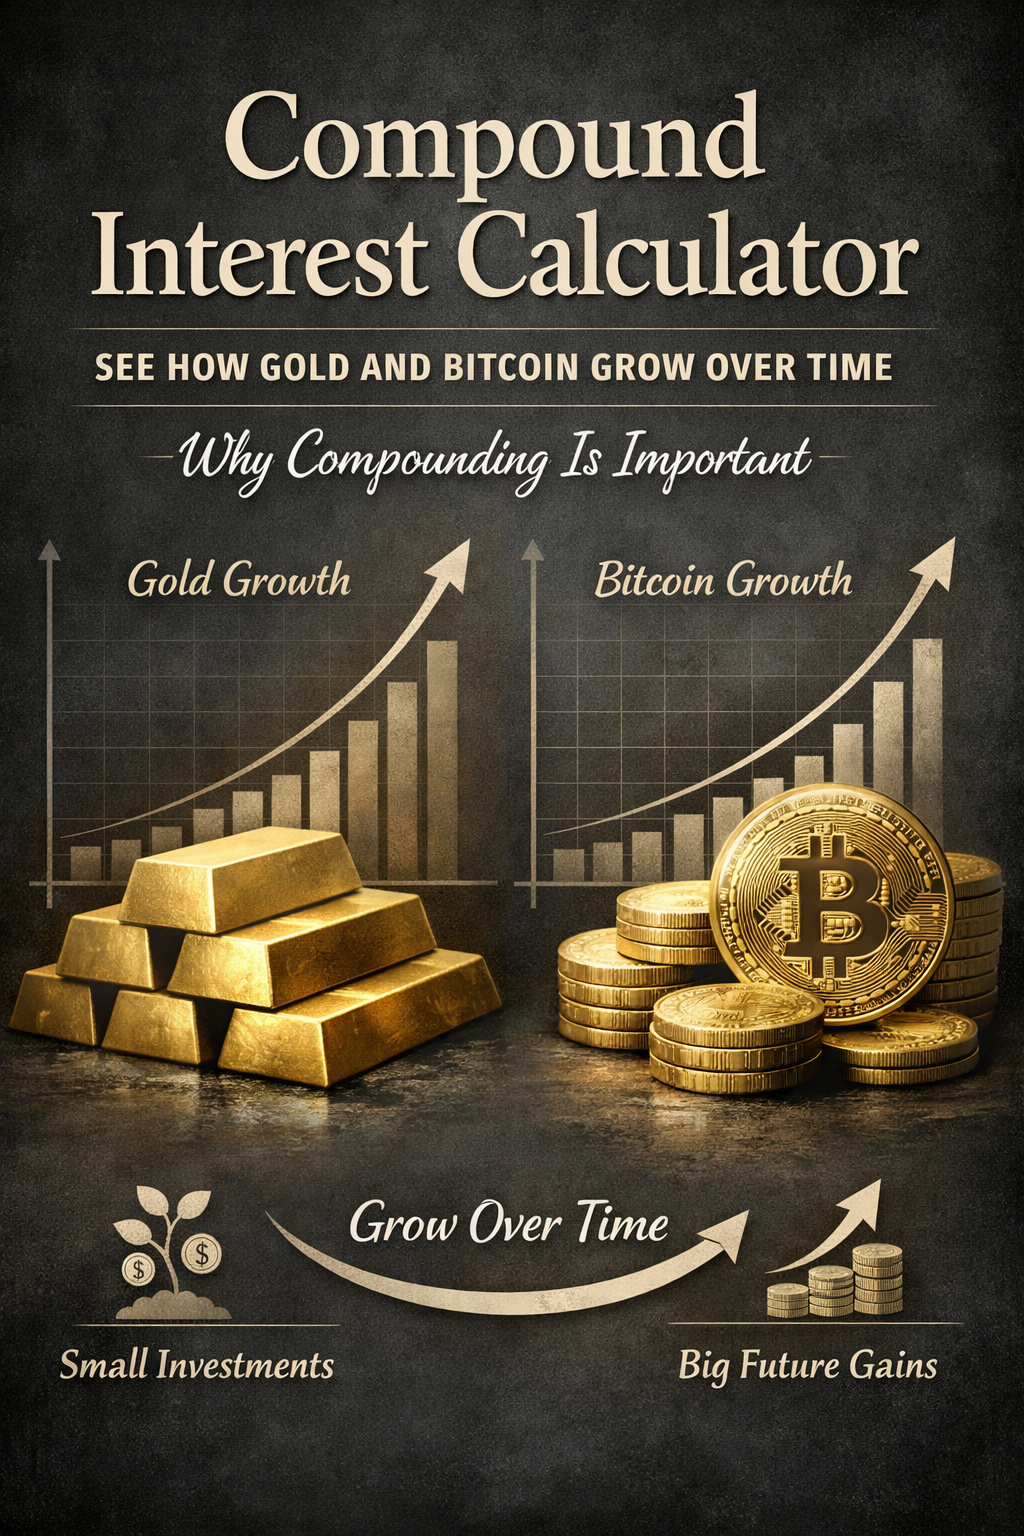
Compound Interest Calculator: See How Gold and Bitcoin Grow Over Time
Read article →

How to Spread Your Investments Across Stocks, Gold, Crypto & Bonds (Simple Guide)
Read article →
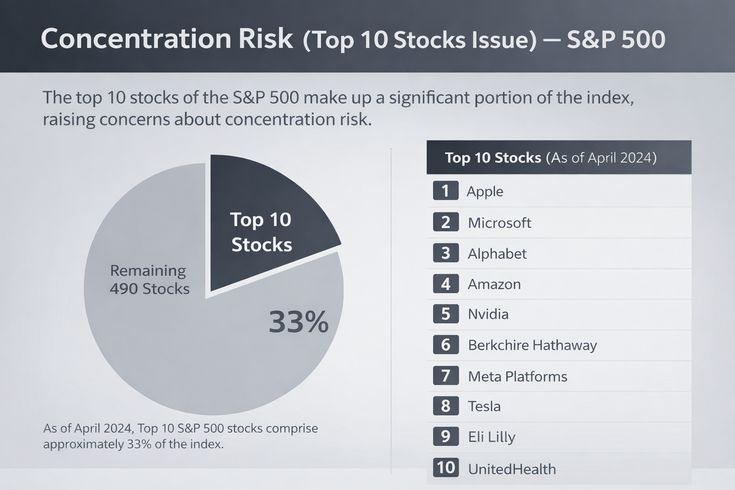
Why Not Just Invest in the S&P 500?
Read article →
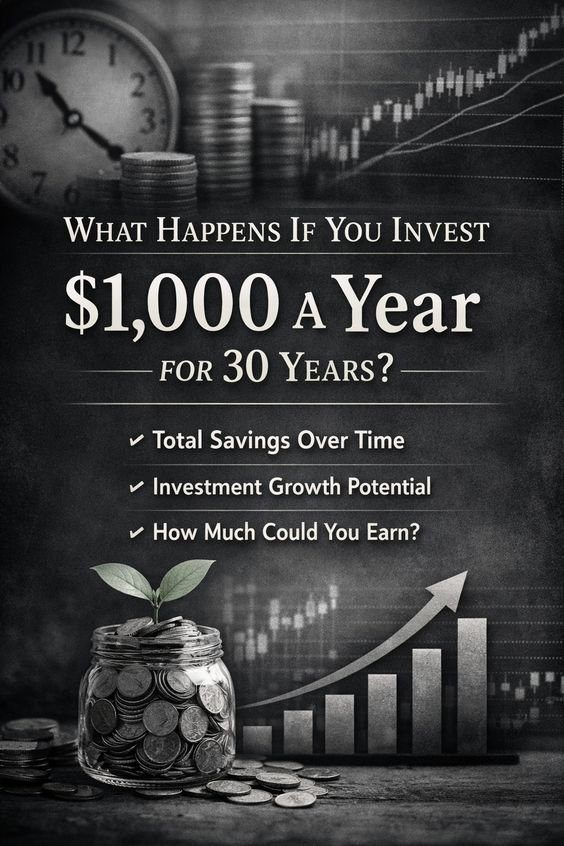
$1,000 a Year for 30 Years: Here’s How Much You’ll Actually Have
Read article →

How Many Assets Should a Portfolio Have? Practical Guide for Investors
Read article →
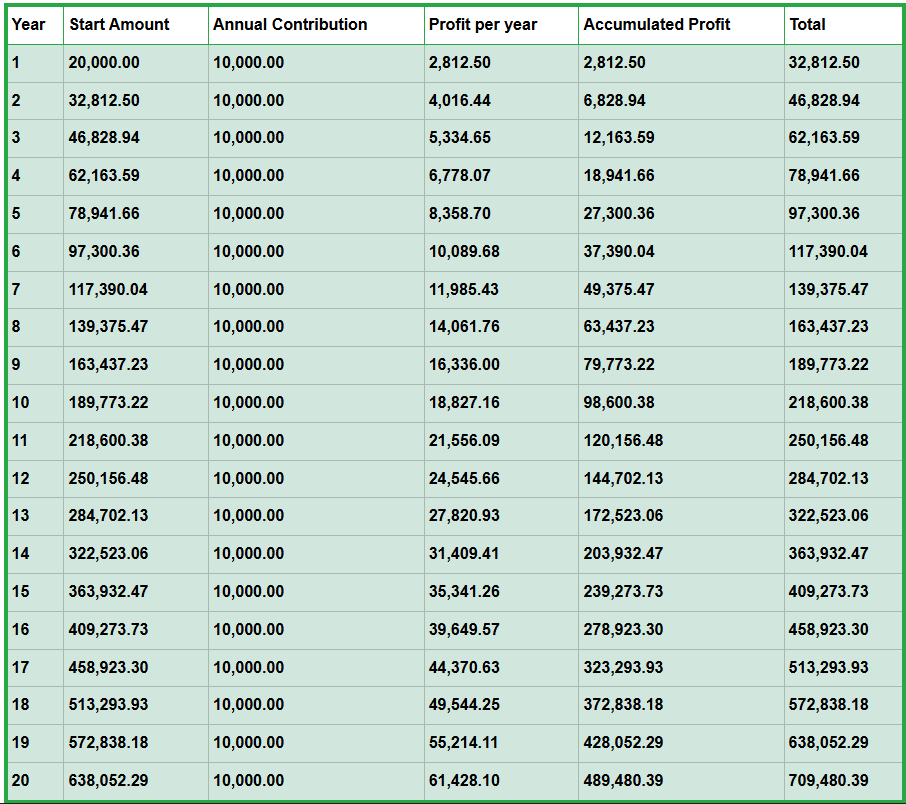
Investment Portfolio Growth Over Time (Year-by-Year Calculator)
Read article →
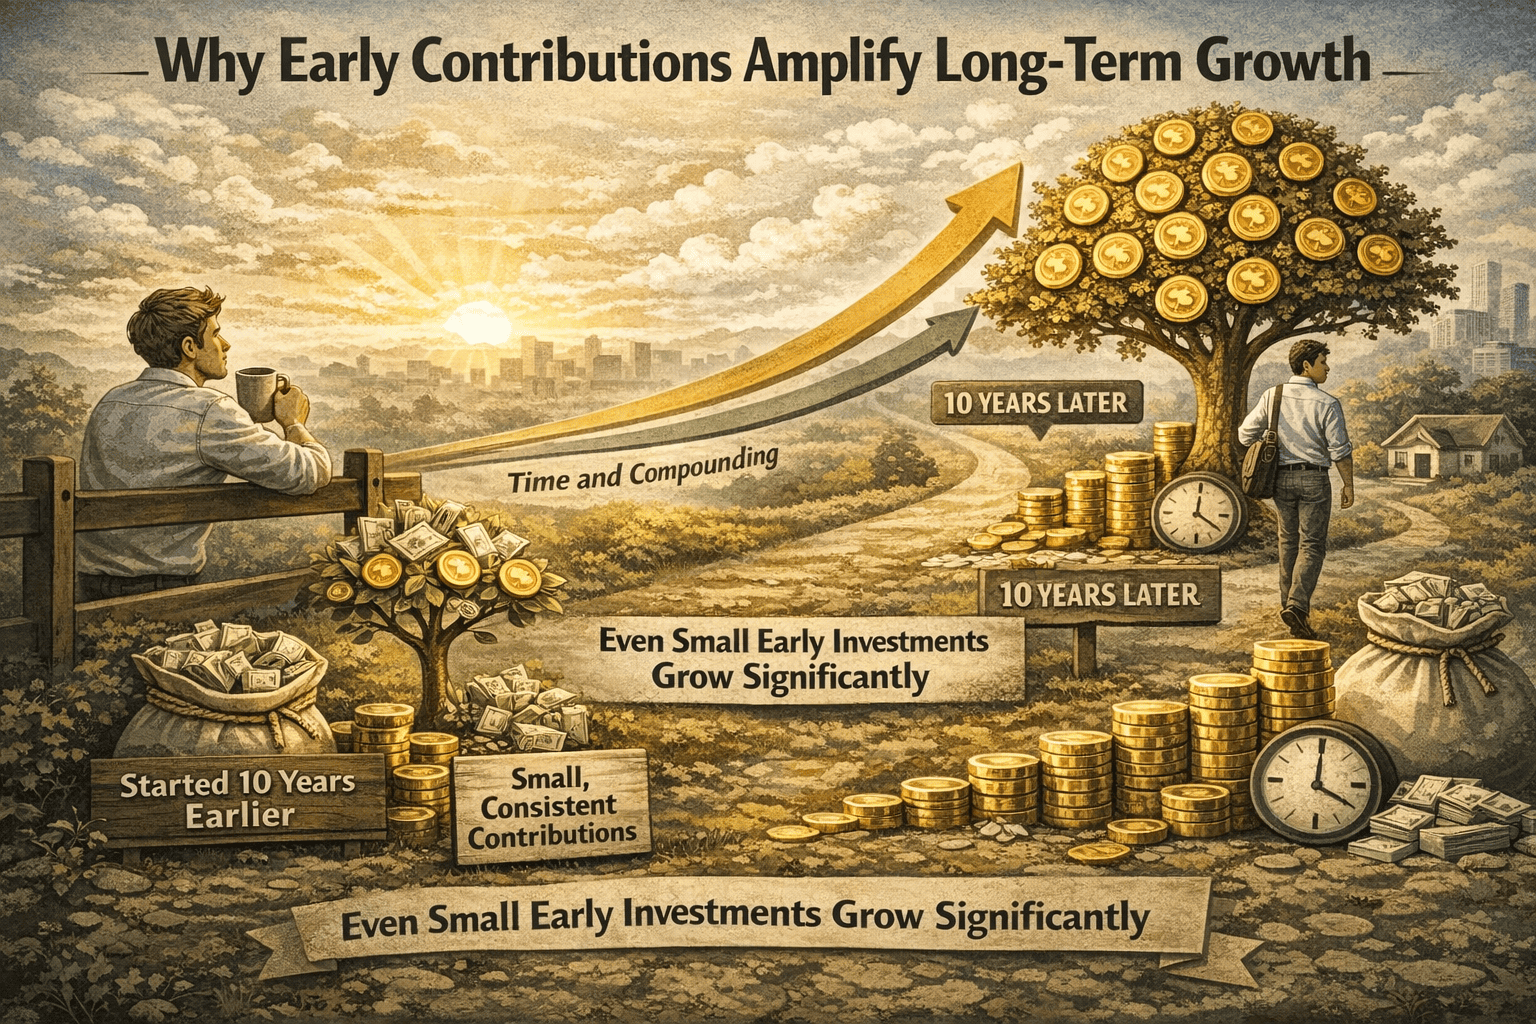
How a 1% Change in Annual Growth Rate Can Transform Your Investment Portfolio | Portfolio Calculator
Read article →
How Inflation Impacts Long-Term Portfolio Growth
Read article →
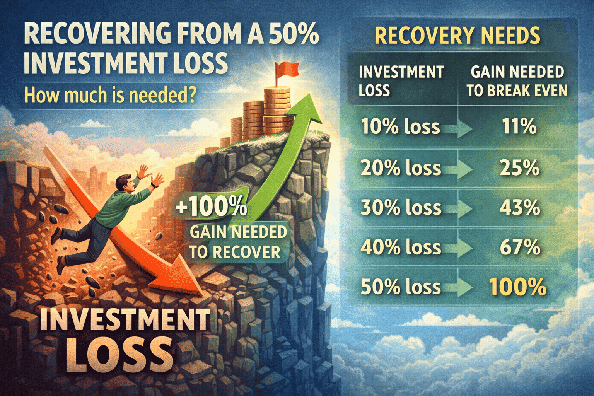
50% Stock Market Loss: How Long Does Recovery Take?
Read article →

How to Build a Diversified Investment Portfolio (Long-Term Strategy Guide)
Read article →
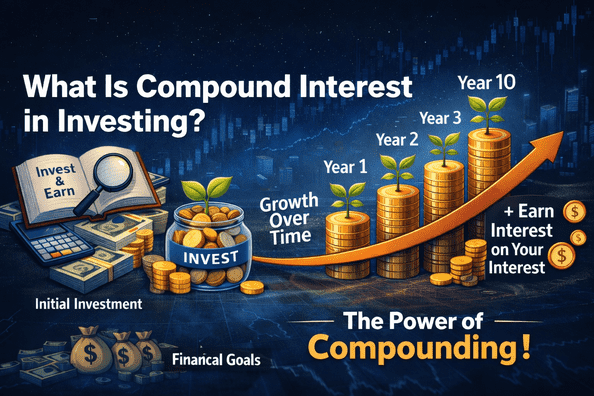
How Investments Grow Over Time: Compounding, Contributions, and Real Returns
Read article →